Stale Data Part 2: Duplicate Detection and APIs
Stephen Barr
Introduction
On the 7th of March 2022, Zerodha, a major stockbroker in India, reported an issue with the National Stock Exchange of India (NSE). Namely, that equity prices were not being updated on the exchange. While this glitch occurred, orders were still being executed in the market, resulting in chaos for India’s largest trading market. During this time, the Sensex index dropped 3%, and the Nifty index dropped 2.58%. Let’s be clear: we cannot attribute these drops entirely to the glitch, but it certainly had an impact. This error occurred just over a year after the same market had to be shut down because of glitches in their servers.
Due to its scale, a major broker picked up on this market-wide issue and allowed them to effectively broadcast it to traders. To prevent this issue, we must examine how to also discover it on the smaller scale. How does a trader identify when their data has gone stale, especially when they are monitoring multiple data feeds in real-time? This business question has led to us developing a program that monitors data feeds to detect, flag, and alert when the incoming data has gone stale, in real-time. We covered some of the fundamental modelling around purely time considerations in our last stale data post – here, we’ll dive into implementation of a similar approach, based on the quality of the data.
Time


Detect where the data has stopped flowing to the consumer or if the data is arriving late. We’ve outlined this in the previous post, linked above.
Quality
We examine the values across the dataset to check that the data coming in is within expected ranges, or presets, based on past observations. This includes checking that data isn’t repeating. The functions related to checking data quality are outlined below.
The approach to the problem
For a realistic proof of concept, we developed two key components – capture and analysis. First, a Python module that pulls in live stock market data and processes it into a “tick”, examined by the second module. This second module is comprised of a Kafka consumer, as well as numerous specialty functions; some to process the received ticks, some to perform the desired checks on the data.

Kafka and Redpanda
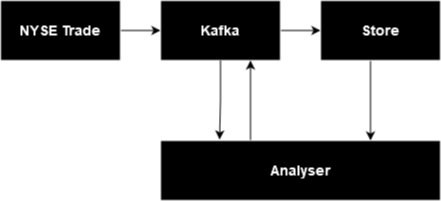
We built the generator first, which, over time, generates and streams multiple stock market entries to Kafka, the analyser, and then the table store. We also included the ability to simulate the issues that the program would need to detect; generating duplicated and repeated data. While there are a number of options, we chose to use Python/Polars and Kafka for this.
Why Kafka? Kafka is an industry standard event streaming platform that allows for one Python script to generate the ticks, along with their abnormalities (for testing purposes). It then sends this information to a topic which is consumed by the consumer (in this case our monitoring program), providing us with a live data stream. To make sure we can receive data from any kind of data source (not just Kafka), we introduced a translation function to convert the format of the source to the format of the destination.
We’ve used Redpanda as our Kafka solution for this project as it allows the user to avoid the complexity associated with Apache Kafka and Zookeeper, as with Redpanda all that is needed is a docker container.
Within the generator we read in historical NYSE Trade & Quote (TAQ) data and replay this to generate a realistic feed of real-time data. We can then send the feed to our Kafka topic via Redpanda to be consumed in our process program. Here, Kafka serves as the bridge between the two programs and simulates a realistic use case. The data feed is achieved by simply looping over the NYSE data set and publishing each row (after some processing to tidy and introduce breaks) to the Kafka topic, which is then consumed by the monitoring program. Redpanda is simple and useful, and a more detailed breakdown of how it works can be found here.
Below is a simple Kafka consumer with a built-in timeout function. In this example, we’ve used a simple threshold based on the previous post, a number of milliseconds determined by the one-in-a-billion probability set before.
Time: Simple Staleness Check
With the above feed, we can easily implement a staleness checker for live data directly in the data consumer itself. Note this is relatively sweeping, as we expect this consumer to stay up all day, and we’ll need a one-size-fits-all approach to time thresholding, but using the analysis from our previous post we can set this at an appropriate value. For NYSE TAQ, a few hundred milliseconds would be entirely reasonable.
Below we roll this threshold directly into the Kafka consumer itself, automatically raising an exception if the feed breaks.
from kafka import KafkaConsumer

def setup_kafka_consumer(timeout_time):
    """
    inputs:
    timeout_tick (int) - timeout wait in ms before flagging a break

    output:
    consumer (object) - Kafka consumer providing messages
    """
    # Set up the consumer for the topic and bootstrap server
    # Timeout gives the consumer wait time
    consumer = KafkaConsumer(
        "tick_gen",
        group_id="my-group",
        bootstrap_servers=["localhost:9092"], #redpanda location
        consumer_timeout_ms=timeout_time
    )

return consumerQuality: Duplicate Detection
We can define a single column or multiple columns in which to check for duplicate values from one entry to the next. For example, in a highly liquid market, we wouldn’t expect repeats of the same stock price over multiple ticks, as the stock price is constantly changing. If two consecutive ticks were observed with the same value, we would flag them as a cause for concern. This is typical of a system generating data in calculation cycles – when the input stalls, the output repeats. Detecting stationary values can help identify an issue further up the chain.
Fuzzy Matching

Support for fuzzy matching was developed so sufficiently similar string values would be flagged as duplicates. The threshold for what is considered a duplicate is defined by the user. The “thefuzz” Python package was used for this.
This package uses the Levenshtein distance metric to measure the difference between two strings. This works by calculating the number of changes you’d have to make to one string to turn it into another string. For example, ‘sitting’ and ‘kitten’ would have a Levenshtein distance of 3 since three changes are required: s → k, i → e, and the deletion of the g at the end. Additionally, the package uses the Levenshtein similarity ratio which also takes the length of each of the strings into consideration.
The Levenshtein similarity ratio is calculated using the formula on the right, where |a| and |b| represent the lengths of the strings and the lev term represents the Levenshtein distance. For example Data Trades and Data trade are two broker names in the example data; it’s clear these refer to the same broker. Neatly, we can use this for int fields too, since our primary use is looking for no change.
Below we’ve implemented a simple check: keeping the last tick of data (either globally or per-symbol, exchange, etc) and comparing it to the latest tick gives us a simple, robust quality check for duplicates, without the need to look back at huge swathes of data. This can be simply rolled into the consumer above, or live separately and report duplicates elsewhere – either way, we can construct a simple per-tick “quality” of timeliness and duplicate state as below. Note that the duplicate_count column refers to the number of duplicates flagged for a given row across each duplicate check. For example, if a duplicate timestamp was detected as well as a duplicate fuzzy match on the broker name, this would return 2; if instead only a duplicate was detected on the broker name it would return 1.
def detect_duplicate_fuzzy(df_latest_tick, df_prior_tick, columns_check, threshold):
    """
    detect:
    inputs:
        df_latest_tick (polars df) - a polars dataframe containing the latest tick dataframe a single row.
        df_prior_tick (polars df) - a polars dataframe containing the prior tick (2nd latest) dataframe a single row
        columns_check, (list) - a list of column names to check for fuzzy duplicates.
            Only these column names will be checked for duplicate entries between the latest and prior ticks
        threshold (int) - an int variable between 0 and 100 that if exceeded or matched will flag the values as duplicate

    output:
        duplicate_fuzz_count (int) - this int will denote how many fuzzy duplicate columns are detected
            this cannot be larger than the length of the columns check list.
    """
    # This checks to see if this is the first tick read into the monitor
    # treats it as such if the type is the initial value of df_prior_tick which is an int before becoming a dataframe
    if type(df_prior_tick) == int:
        df_prior_tick = df_latest_tick
        duplicate_fuzz_count = 0
        return duplicate_fuzz_count
    else:
        duplicate_fuzz_count = 0
        for check in columns_check:
            if (fuzz.ratio(df_latest_tick[check].item(), df_prior_tick[check].item()) >= threshold):
                duplicate_fuzz_count += 1
            else:
                duplicate_fuzz_count += 0

        return duplicate_fuzz_count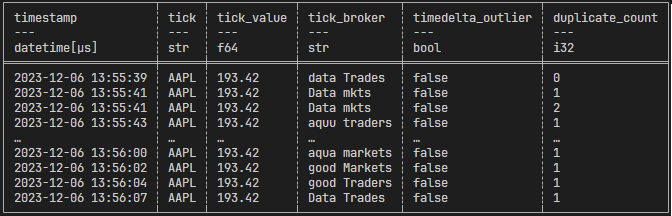
Conclusion
While the scope of this proof of concept is to examine live stock market ticks for data quality and timeliness issues, we kept the code general to allow for its adaptation to many different use cases. We’re also taking steps to include features such as a time-weighted variance, as well as notifications via Microsoft Teams and E-mail. Beyond this, we’re researching new metrics and methods of detecting data quality issues to incorporate into the program.
The NSE issue with prices not being updated on the exchange was quickly spotted by a major stockbroker due to the macro nature of problem. This may not always be the case as if it is an issue with a specific stock or an inhouse issue for a firm there will not be the same degree of oversight. With tools like those described above, checking the timeliness of tick data makes it possible to automatically flag any potential issues for the user without having to rely on an outside source such as Zerodha.
This reduction in latency between the error occurring and the end user finding could result in a large decrease in losses due to trading on stale information. With the blue chip index of the NSE, the NIFTY 50 dropping 2-3%, being able to detect this market-wide data issue ahead of press releases from outside agents could have mitigated loses suffered as a result. The NSE suffered similar technical issues in 2017 and 2021 requiring trading to be halted, so having internal tools to detect these issues and take action could significantly reduce costs which would result from the delay in action if relying on third party information.
Share this: