Jonny Press
kdb+ runs some of the most demanding systems in capital markets, but it is not a standard technology for support teams to run. This isn’t unique to kdb+, but a function of any specialised technology sitting in a general support estate, where a niche system has to be looked after by people whose day job spans everything else. At some clients we work with there is a dedicated kdb+ team who know the system inside out. More often than not, kdb+ sits inside a general support group who look after a capture system alongside other technologies, all of which behave a bit differently.
Well defined run books help hugely, but novel problems require investigation. The kdb+ estate is usually doing much more than “just database” things; it will usually be responsible for streaming analytics and anything involving real time data. It is common that developers become involved in support issues, meaning that the people best placed to build are spending their time firefighting instead.
Issues can fall into one of several buckets. They span hardware problems, data problems (missing feeds, unexpected volumes etc.), resource contention between processes or users, human error, or just software bugs. There are investigative patterns to follow: check all the processes are running, check the system stats, check the logs, cross reference against a secondary or DR system etc. It can be slow, it needs a fair amount of technical confidence and much of it is the kind of data correlation and context-juggling that people aren’t always good at (but machines are).
Why Is My Query Running Slow?
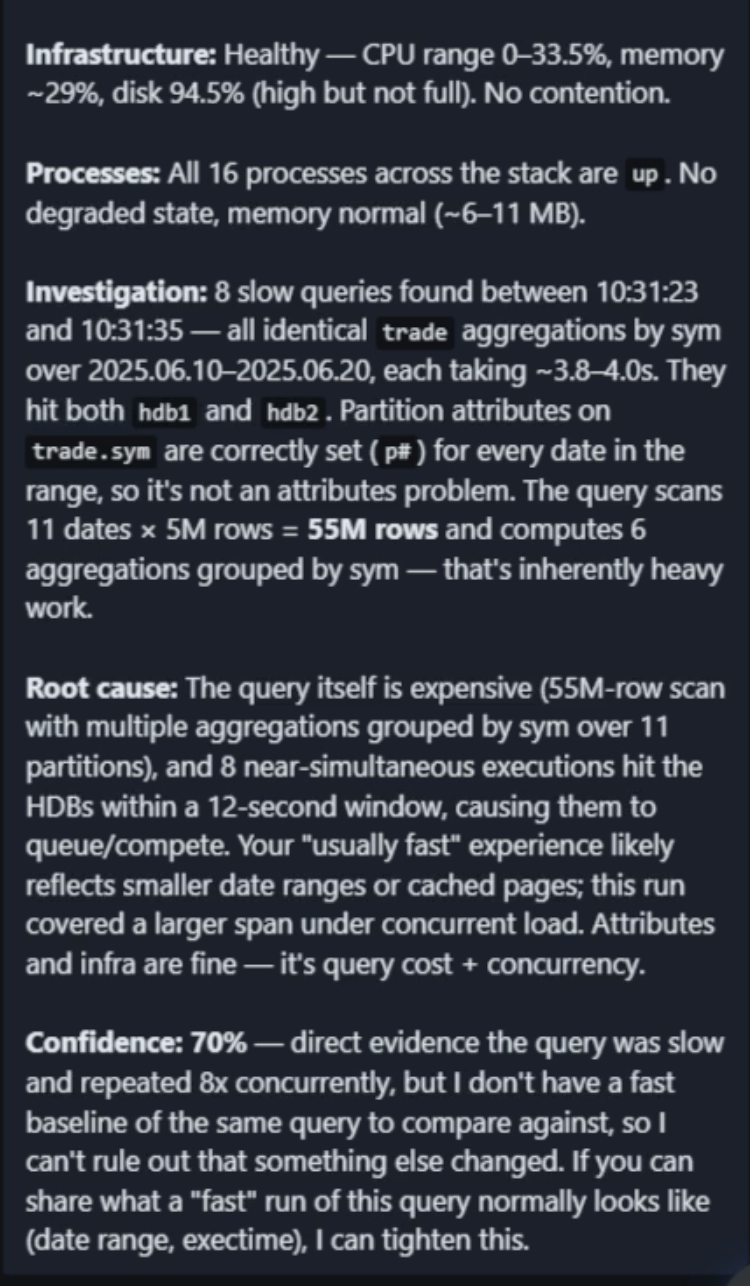
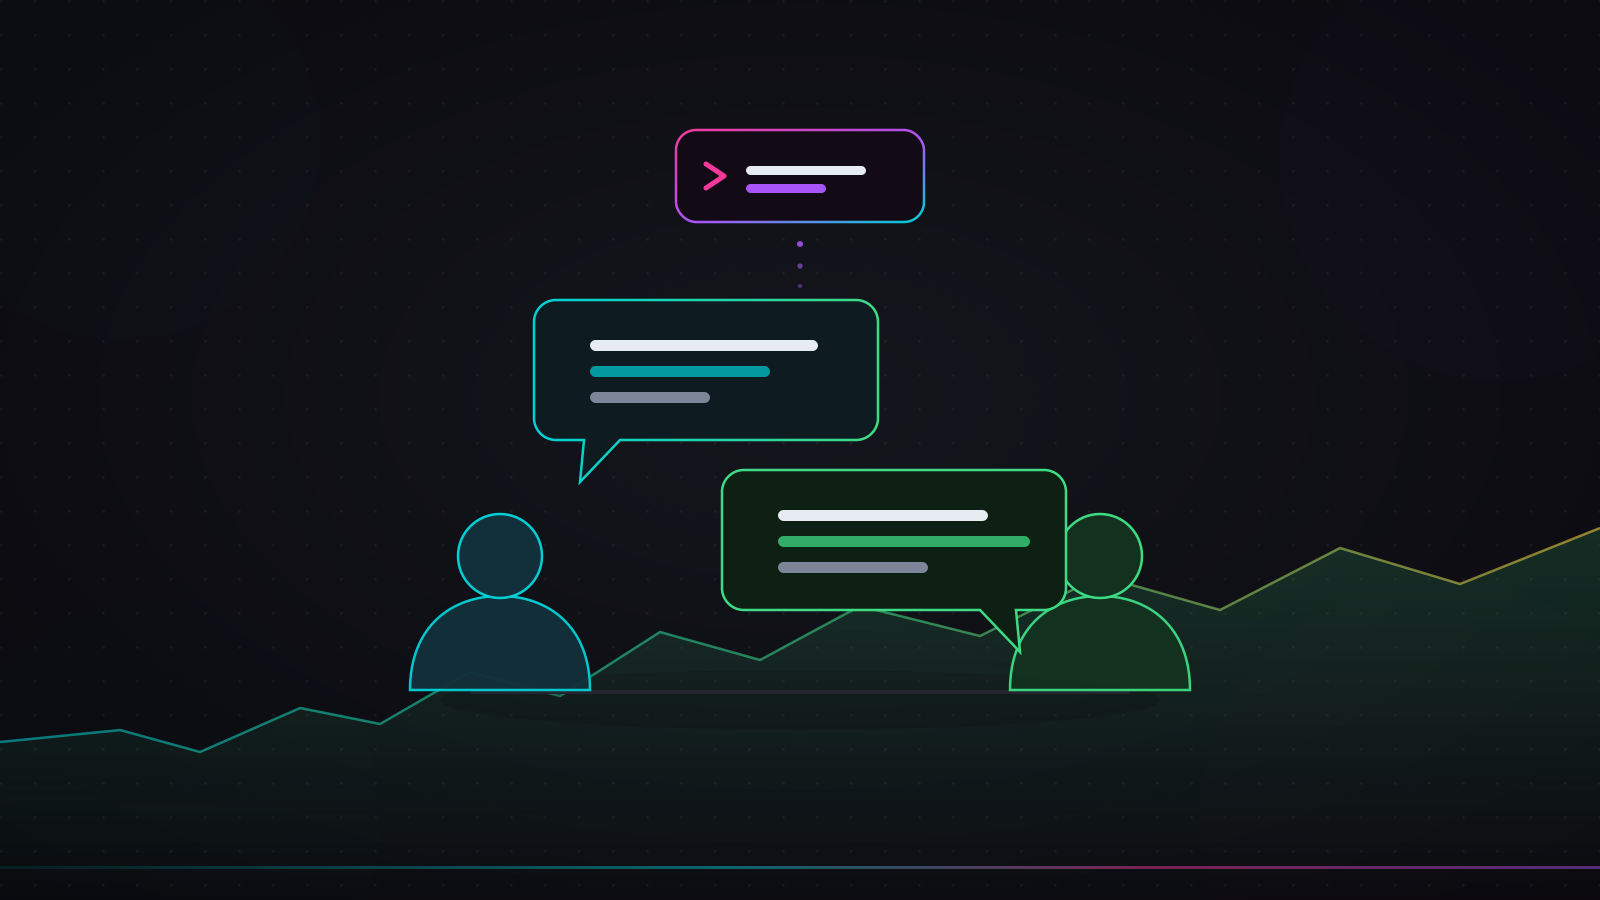
A simple question like this could have several root causes: hardware contention or failure, process failure, software bugs, data volume increases, or user contention to name a few.
The goal we have set is to lift the capability of the support team and take the repetitive work off their hands, as well as moving the line where developers are called upon. An AI assistant gathers the same information, reasons over it and comes back with a plausible diagnosis and a suggested remedy.
This work extends our production AI assistant and our Surveillance AI assistant.
How Does It Work?
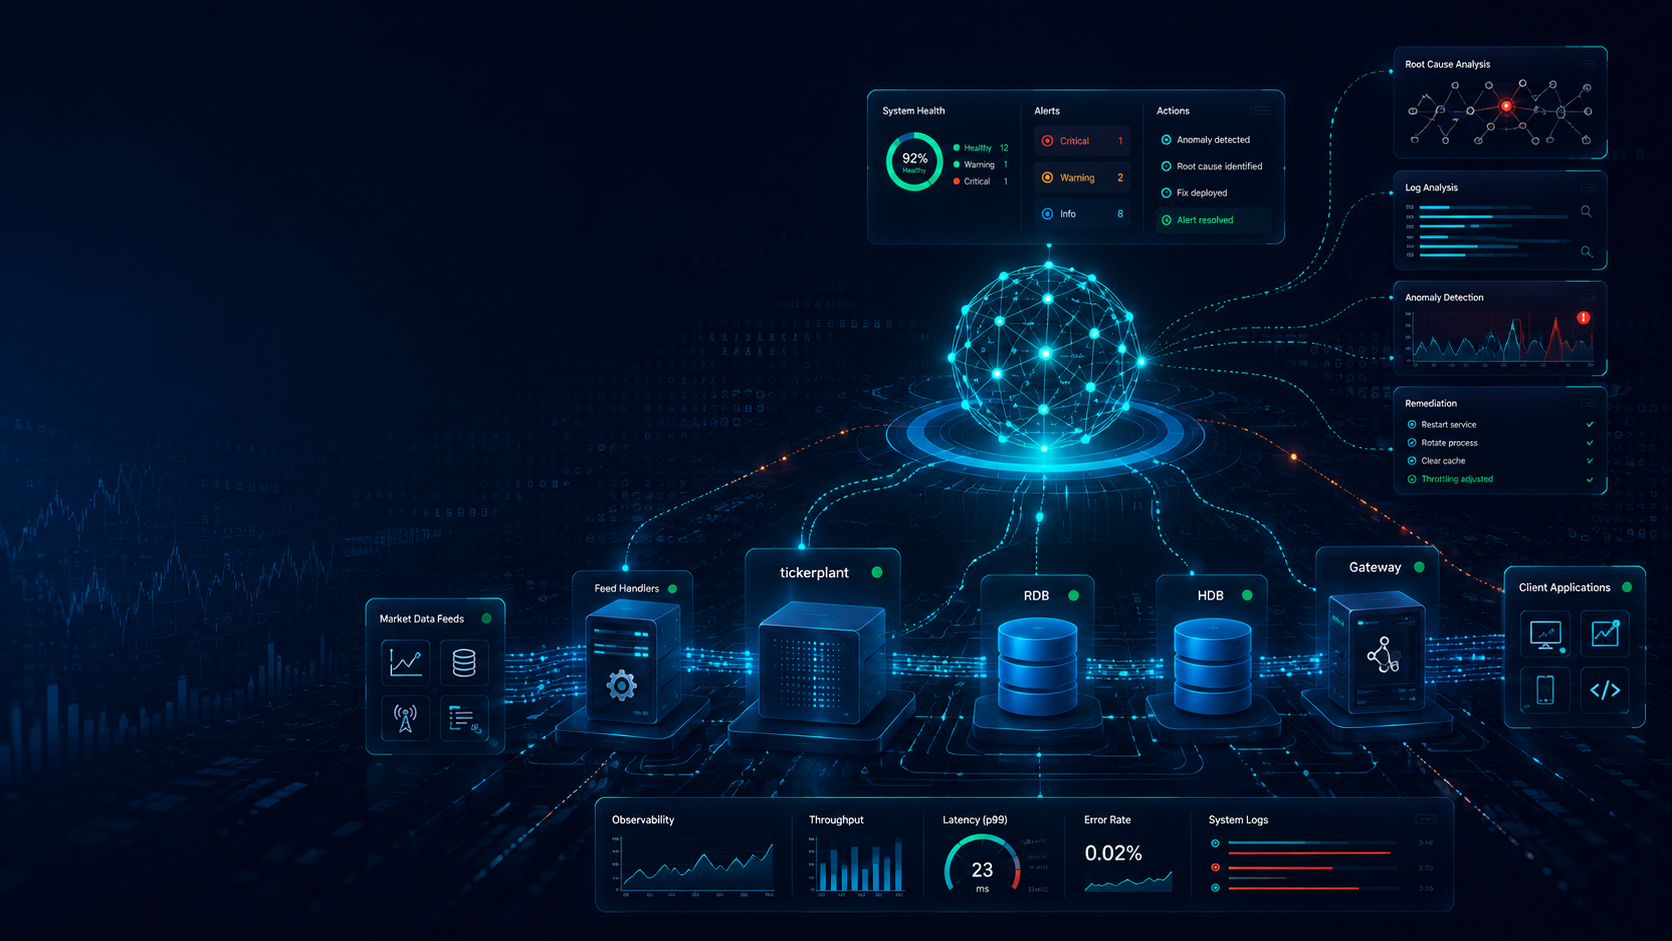
The architecture follows a similar pattern to that we have used across our AI assistant work. Operational data related to the applications being supported is captured into a central database; a number of our clients already have something like this. Agentic investigations are instigated via “incidents” which are created in one of two ways:
- via the chat interface- a user asking a question; or
- via the classifier.
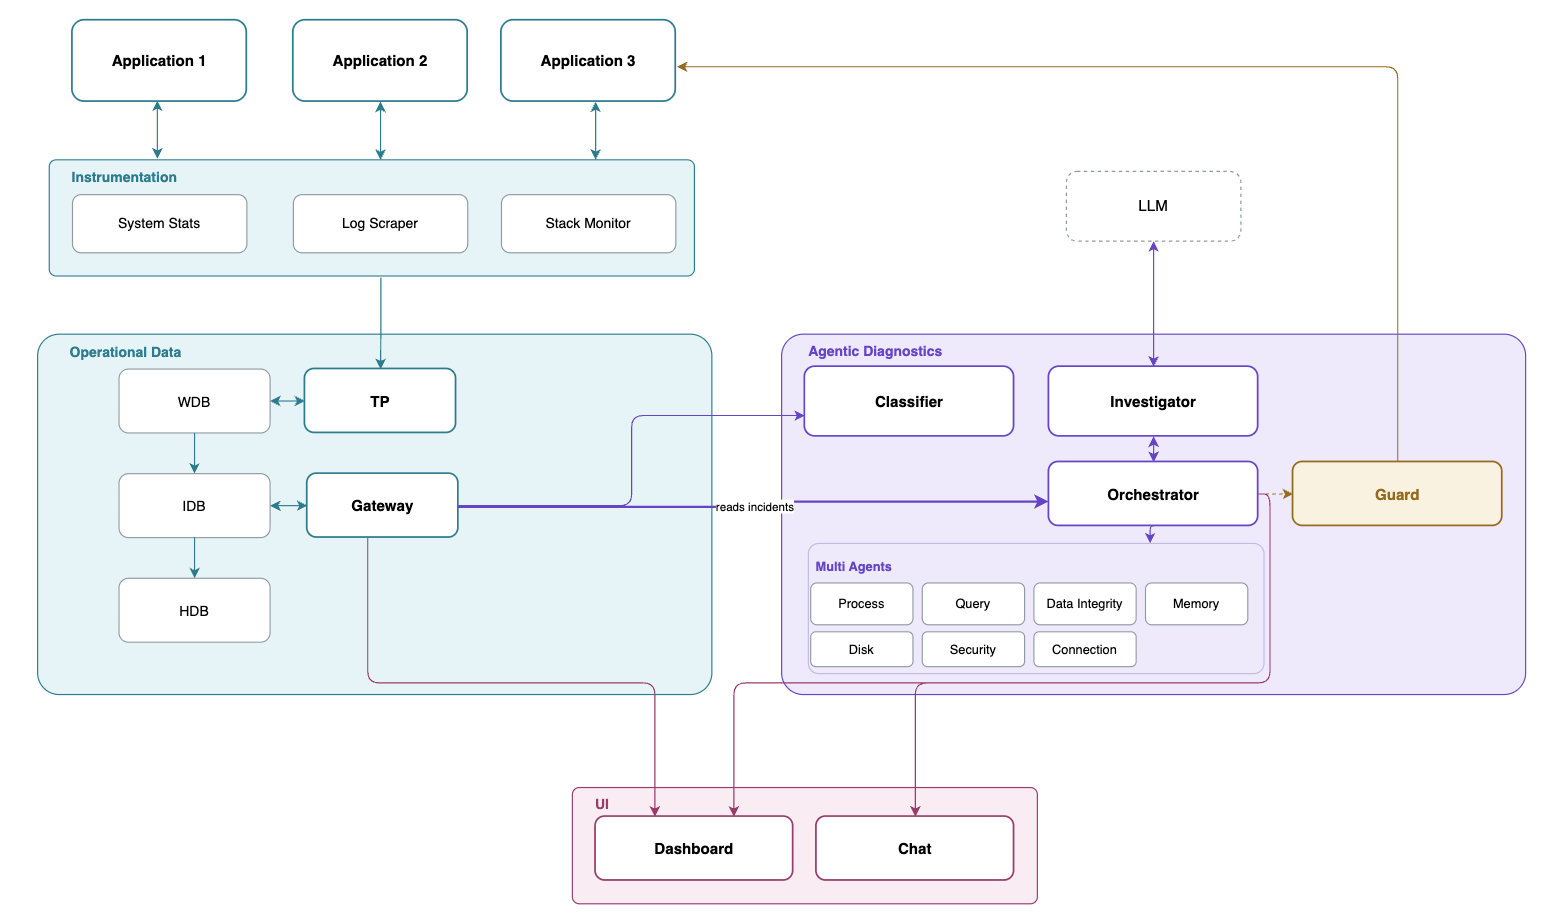
The classifier reads the data flowing into the operational database and decides whether it needs investigated or not. Examples of things to be investigated might be log messages tagged as “ERROR”, or query metrics showing long running query times.
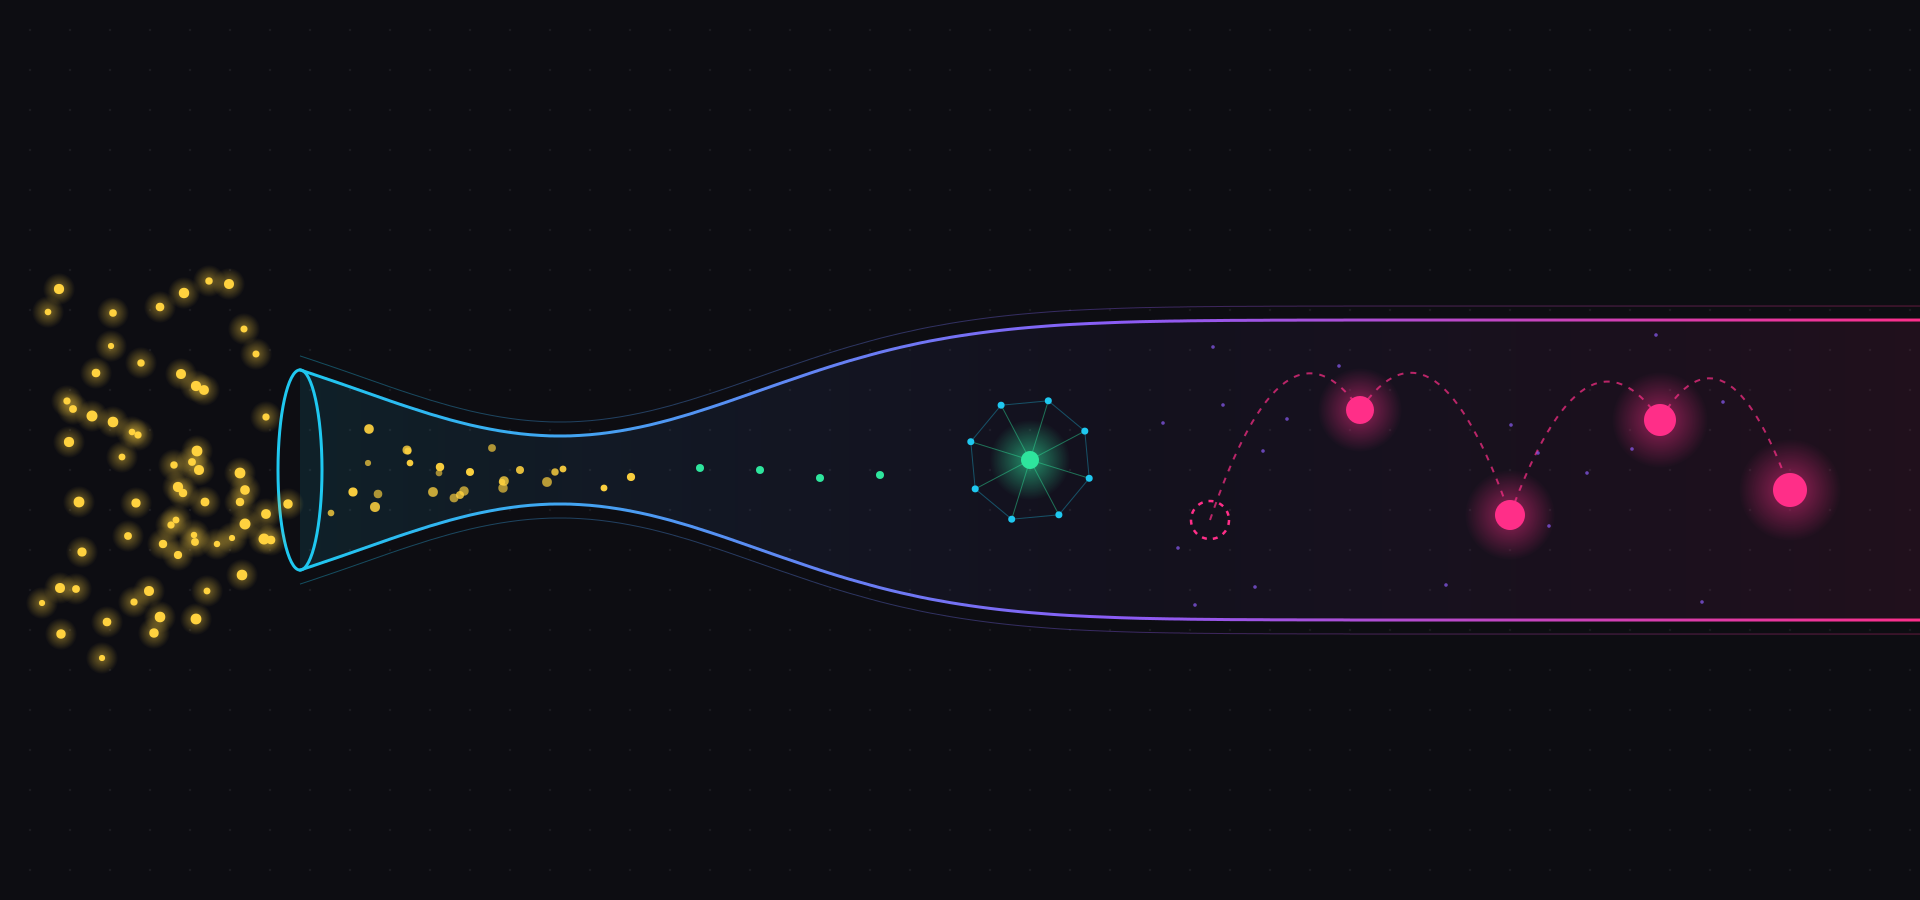
When an incident is created, it is picked up by the investigator. It utilises the AI model to work out what question is being asked, decides where to go for the answer and keeps track of the investigative thread as it goes, carrying context from one step to the next. The investigator utilises a series of sub agents to investigate specific parts of the system and loops until it reaches a conclusion or a maximum number of investigative steps. The agents can access both the operational data and in some cases the upstream applications themselves to investigate, for example, data issues. Access is via a Guard component which validates if the query is ok to run, only allowing it if it does and returning an instructive response to try again if it’s not.
We made the models selectable. In a lot of our work, we found that internally hosted, local models do the job, which brings benefits for a support setting: consistency in how the system behaves, availability that doesn’t depend on an external service, and the option to keep sensitive operational data inside your own environment. External models can change without notice, so running with a locally hosted model reduces an element of the non-determinism.
The answers provided comes back with the evidence behind it, the underlying queries and a record of why the assistant went the way it did. In an operational context an engineer acting on a diagnosis needs to be able to see the working before they trust it.
Every step of the reasoning loop, the tools it called, the queries it ran, the intermediate findings and the path it took to a conclusion, is written back into the database. The data serves four purposes:
- it gives you a queryable record for analysis, so you can see how investigations actually play out over time;
- the support questions can be analysed for patterns for proactive action, e.g. “users always ask questions like this about system X”;
- it provides training material to refine and improve the assistant against your own systems; and
- it leaves a complete audit trail, so any decision the assistant made can be reconstructed and justified after the fact.
Where To Go Next
In all cases, the support engineer is still in charge, with judgement, decisions, and accountability staying with the human-in-the-loop.
The point of this is endeavour is to elevate the capability of support analysts, and to free up developer time. The best support analysts are those that stick around for a long time, and know where the bodies are buried (have institutional knowledge). Therefore integrating additional internal datasets are a natural next step; code, documentation, support tickets etc.
As kdb+ estates grow and the systems around them get more tangled, the teams running them need more support than a rules-based monitoring dashboard can give. Augmenting that team with an assistant that can investigate, diagnose, and remember is a practical way to close the gap.
Want To See A Demo?
Share this: