Low Latency Java – Optimisation through Garbage Collector Tuning
Mark Salters
In computer programming, garbage collection (GC) was first introduced in 1959 with the LISP language and is the process of reclaiming memory which was allocated by the program but is no longer referenced.
GC is an essential part of Java’s memory management system and is by default managed by the Java Virtual Machine (JVM). This takes away the need/worry of the developer to figure out when objects are no longer referenced and can be removed to free up memory. This is great as it removes a lot of boilerplate code and reduces the likelihood of memory leaks or very serious human errors in the application.
Why do we need to optimise?
A downside of this management of memory is that the JVM will take up a portion of the resources available to the application to run the process. It is also performed in the background and can run at unpredictable times. Furthermore, the process can be heavy and can force the application to slow down or pause for a certain amount of time. This can be quite a big issue for applications that have a strict latency requirement and is why it is crucial that it runs as efficiently as possible. There are a few things we can do to achieve this.
Choosing the right garbage collector
Garbage collector performance is typically evaluated based on three markers:
- Throughput: The rate at which processes complete application work. The more time the application is working compared to the overhead time spent in doing Garbage Collection work, the higher the throughput of the application is.
- Memory Footprint: The amount of memory used by the garbage collector.
- Pause Time: The length of time the application is stopped during a garbage collection.
For some applications the choice of garbage collector doesn’t really matter. They can perform just fine with small pauses of modest frequency and using a small amount of memory. However, this isn’t the case for all applications, particularly ones dealing with a large amount of data, many threads and high transaction rates.
There are currently four types of GC supported by the Java framework.
Serial
Rarely used in Java. Performs collections on a single thread. It uses the mark-compact collection method which moves older memory to the front of the heap so that new memory allocations are made into a single chunk of memory at the end of the heap. This makes it fast in allocating new chunks of memory to the heap. Because it runs on a single thread, it has low resource usages which makes it ideal for applications running on a single CPU (Central Processing Unit). However, the single thread usage also makes garbage collections take much longer so Serial GC cannot be used by applications that have low pause time requirements.
Parallel
Also known as Throughput GC. Like serial but uses multiple threads for performing garbage collection and can be used in applications with more than one CPU. This reduces the serial execution time of the application in java and speeds up the process but still requires longer pause times than the newer garbage collectors.
Garbage First (G1)
The default GC since Java 9. Improved upon the now removed Concurrent Mark Sweep (CMS). It attempts to take a balanced approach, meeting pause-time goals with low resource usage and adequate throughput. G1 is a generational and regional garbage collector, which splits the heap into two main sections, the young generation, and the old generation. The young generation is further broken down into Eden and survivor partitions, with the survivor partition having further sub-partitions, S0 and S1. New objects are created in the Eden partition, and if this partition ever fills, a minor garbage collection will occur, meaning objects that are still alive/referenced will be moved to the survivor/S0 partition. Objects that happen to survive further garbage collections will be moved between S0 and S1 for subsequent collections, with an object that endures multiple garbage collections being moved to the old generation. The goal of this is to reduce the size of the heap scanned during a collection which should therefore reduce the amount of time taken for the garbage collection to run. Collections in the old generation are called major collections which take more time and resources to run. A full garbage collection is when both the young and the old generations are cleaned up. Full collections are a stop-the-world pause on an application which stops all threads other than the ones needed for the GC work.
ZGC (Z Garbage Collector)
Was first introduced in Java 11 as experimental and was marked production ready in Java 15. Its focus is ultra-low latency and scalability. This makes it ideal for web applications or applications that must handle a large amount of data. It is almost completely concurrent and has low pause times of under 1ms. However, it can be demanding on CPU resources and is not recommended for smaller systems.
For low latency focused application, the ZGC may be the best option. To use this garbage collector, we need to be running java 15 or higher and have a system with more than a single-core processor, with enough CPU resources available to run it. If this isn’t applicable, then G1 GC is still a viable option as it is stable, highly configurable and much more forgiving on systems with less resources.
Upgrade your version of Java
With each iteration of Java, all versions of garbage collection have had performance boosts. This is especially true for latency and pause time.
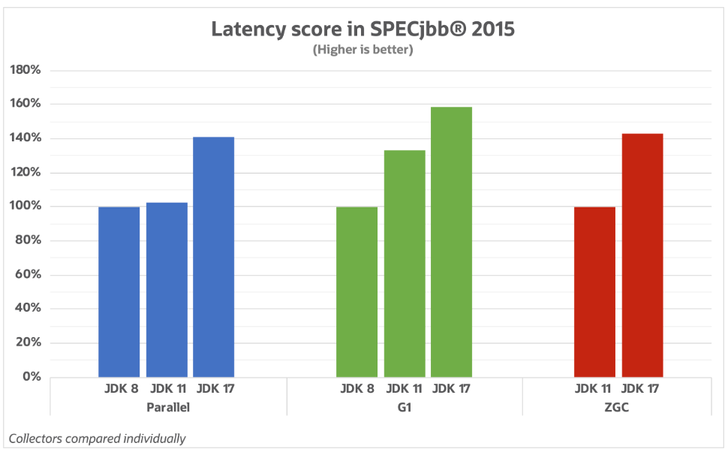
Source ( GC progress from JDK 8 to JDK 17 (kstefanj.github.io) )
As the graphs show, each version of Java sees an increase in the latency score, with the G1 GC showing the best progress. This is because much work has been put in to making the GC pause time shorter. When we look at the pause time, we can see the benefit of the ZGC.
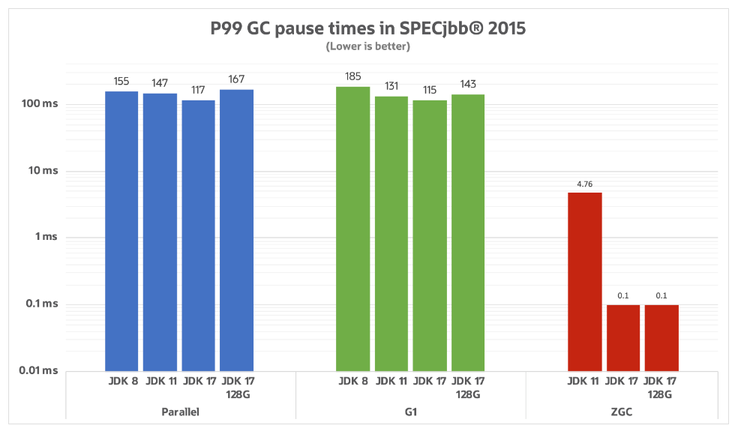
Source ( GC progress from JDK 8 to JDK 17 (kstefanj.github.io) )
ZGC pause time is in the sub-milliseconds, while G1 keeps well below its default pause time target of 200ms. There is an extra bar to show how the collectors handle scalability. ZGC is designed to have pause times that don’t scale with the heap size, so it doesn’t get affected by the increase to a 128 GB heap.
Java 21
With Java 21 came more improvements across all garbage collectors. The first thing they introduced was String deduplication. They recognised that a quarter of a typical heap is made up of Strings. Around half of these Strings are duplicates. All garbage collectors can now track which Strings are duplicates and assign them to a single memory address. This should reduce the run time of a garbage collector and increase throughput. To enable this, you must use the flag –XX:+UseStringDeduplication.
Serial and Parallel garbage collectors had very few changes to them as they are now in maintenance mode. There are improvements to the Class Data Sharing (CDS) feature which should improve start up time for applications running these garbage collectors.
G1 and Java 21
For G1GC, some more changes were made. We can now increase the region sizes of the heap to 512mb (up from 32mb). A region is simply another division of the heap. Each region can be young or old and free memory. This increase in the region sizes will help reduce memory fragmentation for applications. Memory fragmentation is when memory is allocated and released in a way that creates small gaps between memory blocks. This can lead to inefficient use of memory and slower performance. There was also a rewrite of the concurrent refinement process. The process runs in parallel with the application threads and is responsible for maintaining and updating the remembered set (RSet) of each region and creating new references between objects. This rewrite should help to improve throughput also.
ZGC and Java 21
The biggest changes in Java 21 have come to the Z garbage collector. In Java 17, ZGC was not a generational garbage collector like G1GC. This meant that it did not divide the heap into generations and regions so when performing a scan, it analysed the whole heap. Because it is concurrent, the stop times were minimal, but resources needed were much greater than any other garbage collector. It also ran into an issue when the application is allocating memory faster than the GC can reclaim from dead objects. This is called an allocation stall and Java threads are stuck waiting for memory:

This was offset by two solutions, setting a larger heap size (which meant the application was spending more time doing the garbage collection, further reducing throughput) and increasing the number of threads for the garbage collector to make it run faster (which in return is taking threads of the application to use). Neither of these were perfect so in Java 21, work was done to move ZGC to become a generational garbage collector.
The work that has been done on ZGC has seen a significant increase in ZGC’s throughput and memory footprint.
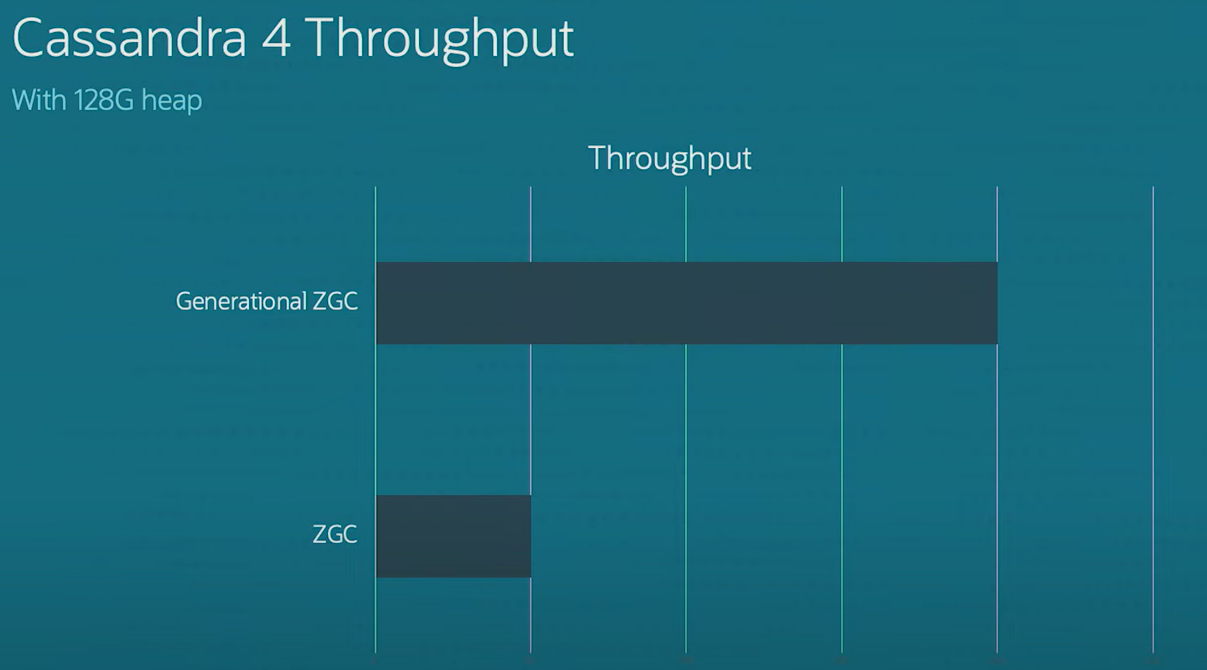
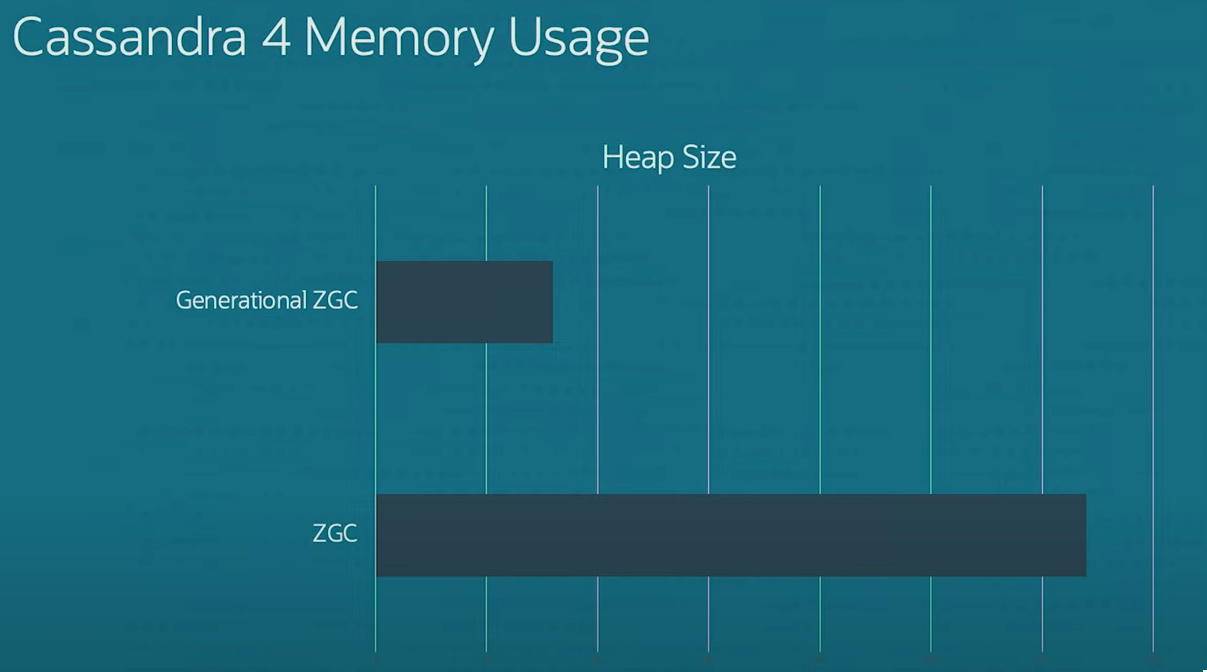
source: ( JVMLS – Generational ZGC and Beyond – Inside.java )
From the graphs we can see that Generational ZGC has decreased its memory usage by 75% and has 4x the throughput compared to its non-generational counterpart. This is all while maintaining pause times below 1ms.
Compared to G1GC, the throughput decrease and memory footprint is still larger when using Generational ZGC but the difference is much smaller. Generational ZGC is 2% less effective when comparing throughput to G1 and uses slightly more memory. However, when we look at pause times, Generational ZGC has latency in the microseconds while G1GC was much higher.
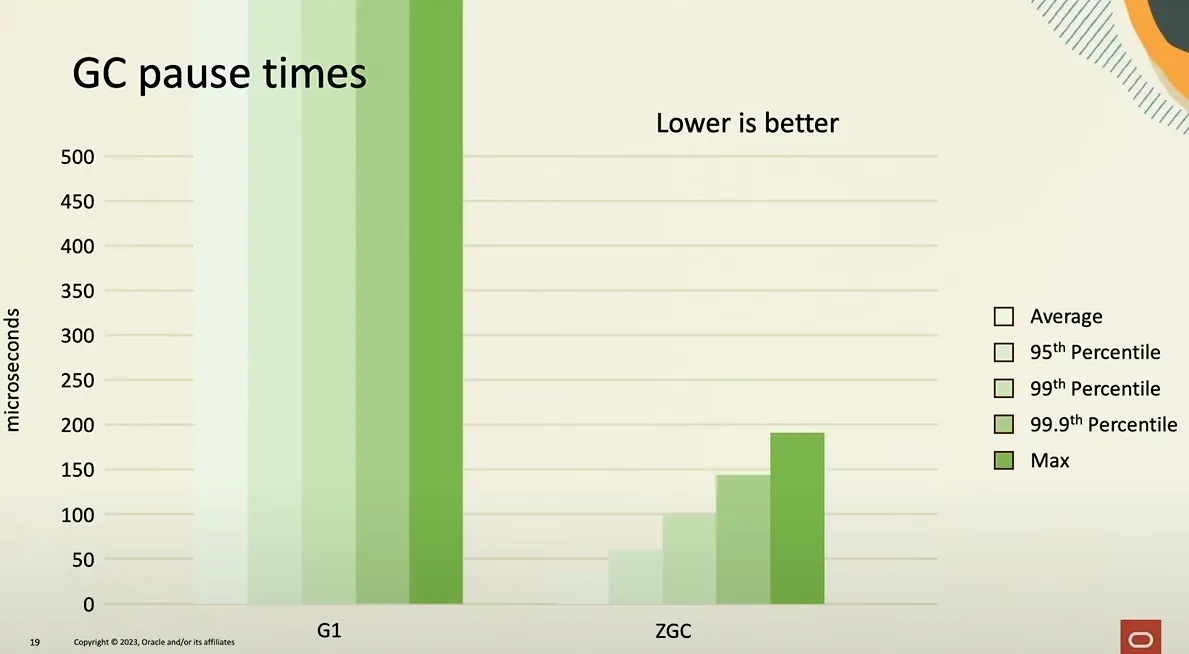
source: ( A New Modern Garbage Collector in JDK 21 | by Ehtiram Abdullayev | Nov, 2023 | Medium )
What we can see from these graphs is that regardless of which GC we choose to use, it is essential to keep up to date with our versions of Java as it increases the performance of our garbage collectors before we even attempt to tune it.
Tuning
By tuning the GC we mean adjusting the parameters of the garbage collector to fit the runtime usage of the JVM memory. This section is split to focus on tuning for G1GC and then for ZGC.
Logging
It is essential to log what the application’s GC is doing and how it is working in order to see potential problems and issues. We can do this by adding a few flags that can log details of the GC:
-XX:+PrintGCDetails – Prints out all garbage collections made by the JVM which can be used by tools to visualize data and look at related performances ( such as Universal JVM GC analyzer – (gceasy.io) )
-XX:+PrintGCTimeStamps and -XX:+PrintGCDateStamps – Adds dates and timestamps to the above logs.
-XX:+PrintTenuringDistribution – Logs the amount of memory that has survived and for how many garbage collections. For example, if your garbage collector’s threshold for moving an object to the old generation is for it to survive 4 garbage collection cycles, you might see something like this:
Desired survivor size 87359488 bytes, new threshold 4 (max 4)
- age 1: 9167144 bytes, 9167144 total
- age 2: 9178824 bytes, 18345968 total
- age 3: 16101552 bytes, 34447520 total
- age 4: 21369776 bytes, 55817296 total
: 759449K->63442K(853376K), 0.0776450 secs] 4704651K->4020310K(6120832K), 0.0783500 secs] [Times: user=0.43 sys=0.00, real=0.07 secs]
Source: ( java – How to read the output of +PrintTenuringDistribution – Stack Overflow ).
-XX:+PrintGCApplicationStoppedTime – prints the time spent inside safepoints. Safepoint pauses occur not only due to garbage collection, but for many other reasons so this needs to be used with the above flags to see when the stoppage was due to a garbage collection.
G1
As explained above, G1 is a generational collector which does 3 kinds of collections. Minor (collection done on the young generation), Major (collection done on the old generation) and Full (collection done on both the young and old generations) garbage collections. The idea of tuning the G1 collector to reduce latency is to ensure that we reduce the amount of time it takes for the minor garbage collection to finish, reduce the amount of major collections done and (if possible) to stop a full collection from occurring at all. This can be done by looking at a few flags.
Heap size
You can set the minimum and maximum size of the heap by using the flags –Xmx and –Xms respectively. Regarding low-latency tuning, most of the time the -Xmx and -Xms values should be set to the same value. This will stop the JVM from attempting to resize the heap which can cause pauses. It will also make the behaviour of the GC more predictable since it is a constant amount of memory to work with. We should also use the flag -XX:+AlwaysPreTouch which will cause the JVM to touch all memory pages during startup, ensuring all memory is within the RAM. This can further reduce latency.
Young generation size
G1GC tries to keep the young generation size between the values of -XX:G1NewSizePercent and -XX:G1MaxNewSizePercent. If the young generation is too large, there will be longer pause times because more objects need to be processed during the collection. Decreasing the size may speed up the garbage collection process at the cost of less work and the need for more memory.
Increasing Promotion Threshold
This can be set by –XX:MaxTenuringThreshold and –XX:SurvivorRatio. This will lead to much less growth of the old generation and therefore less frequent major collections.
Maximum Pause Time
This controls the length of the pauses of the collection and can be set with the flag -XX:MaxGCPauseMillis. By default, it is set to 200ms but can be reduced and the GC will try to meet this goal.
ZGC
In order to use ZGC we need to use the flag -XX:+UseZGC (If you are using anything older than Java 17 you will also need to set the parameter -XX:+UnlockExperimentalVMOptions) as it is not the default garbage collector. If you are using Java 21 then it is better to use Generational ZGC which requires the following flags: -XX:+UseZGC -XX:+ZGenerational.
ZGC is not as configurable as G1GC so there are less flags to play around with. The most important flag to set is the maximum heap size (-Xmx). Because it is a concurrent collector, the heap size must be adjusted in a way that it can hold the live/referenced set of objects of your application and allows headroom to allow allocations while the collector is running. This means it needs to be higher compared to G1GC. We can also set the number of threads that the collector will use (-XX:ConcGCThreads). If we don’t set this, the ZGC will choose based on our applications needs and limitations.
Conclusion
While many applications can run fine with a default garbage collector without any tuning, some applications with strict latency requirements will need to tune the garbage collector to prioritise latency over throughput and memory footprint. While the new ZGC focuses solely on low latency, it requires a system that can cope with a GC that takes up greater CPU resources. The G1GC, while being a balanced collector, is highly configurable and can be tuned to meet an application’s low latency needs. With the Java 21 release, some of the ZGC’s CPU issues have been resolved, making it suitable for some smaller applications as well. In the future, Generational ZGC is set to become the default garbage collector while its predecessor is to be deprecated.
Useful links
A Step-by-Step Guide to Java Garbage Collection Tuning – DEV Community
Introduction to Garbage Collection Tuning (oracle.com)
Java’s Highly Scalable Low-Latency Garbage Collector : ZGC – YouTube
Garbage Collection in Java – Dev.java
GC progress from JDK 8 to JDK 17 (kstefanj.github.io)
Understanding garbage collection in Java | Red Hat Developer
Share this: