Data Intellect
The Java Microbenchmark Harness (JMH) is a handy tool for writing and running benchmarks to analyse the performance of Java code. In this blog I will go through the basics for getting started, what I’ve learned about using it as well as providing some examples.
Introduction
As part of a feed handler development testbed project, with a focus on high performance, I researched tools that can be used to find out more about what is going on under the hood within the Java Virtual Machine (JVM). One of the resources that I discovered was OpenJDK’s JMH, this benchmark suite was added to JDK12 and has become the de-facto standard for micro-benchmarking Java and other languages targeting the JVM.
Getting Started
Recommended approach
The recommended approach is to create a stand alone project from the command line using the following Maven archetype command, you can then add a dependency to the project that you wish to base your benchmarks on, if required.
mvn archetype:generate
     -DinteractiveMode=false
     -DarchetypeGroupId=org.openjdk.jmh
     -DarchetypeArtifactId=jmh-java-benchmark-archetype
     -DgroupId=org.sample
     -DartifactId=test
-Dversion=1.0Alternative approach
Alternatively you can run it from an existing Maven project by adding the following dependency:
<dependency>
     <groupId>org.openjdk.jmh</groupId>
     <artifactId>jmh-generator-annprocess</artifactId>
     <version>1.37</version>
     <scope>test</scope>
</dependency>You can then run your benchmarks from a JUnit test like so:
@Test
public void runBenchmarks() throws RunnerException {
     Options options = new OptionsBuilder()
            	.include(this.getClass().getName() + ".*")
            	.build();

     new Runner(options).run();
}

@BenchmarkCommon Annotations and Settings
@Benchmark
is used to annotate a benchmark method.
@BenchmarkMode
is used to set the benchmark mode, the possible enum values you can set this to are Throughput, AverageTime, SampleTime, SingleShotTime or All. See JMHSample_02_BenchmarkModes for more details.
@OutputTimeUnit
is used to set the unit of time to be used in your performance metrics including Nano/ Micro/ Milliseconds, Seconds, Minutes, Hours or Days.
@State
allows us to define the state of fields with a scope of either per benchmark or per thread. The thread scope can be useful if running multi-threaded benchmarks. If we only need one state object this annotation can be used at the class level, otherwise we can use it on inner classes. See JMHSample_03_States for more details.
@Param
is used to mark a configurable parameter, @Param fields should be non-final fields and should only reside in @State classes. The annotation value is given in String, and will be coerced as required to match the field type. See JMHSample_27_Params for more details.
@Setup & @Teardown
are used to annotate fixture methods that act on @State objects, these can be used for setup or housekeeping tasks outside of the measured code section. See JMHSample_05_StateFixtures for more details.
@Warmup & @Measurement
are similar in that they share common options you can set, these are the number of iterations, the time, the timeUnit or the batchSize. Obviously @Warmup is for the warm up runs, which are not measured, and @Measurement is for the measured runs.
@Fork
is used to set the number of JVM forks. Forking (running in a separate process) is enabled by default in the JMH. Running benchmarks within the same JVM is wrong because of how the JVM optimises an application by creating a profile of the application’s behaviour. The fork is created to reset this profile and ensures that benchmarks are unaffected by other benchmarks or the order they are run in. See JMHSample_12_Forking for more details.
JVM Warmups
A key feature of the JMH is how it performs warm up iterations before measuring performance. It takes time for a Java application to reach optimal performance, this is mainly due to the Just-In-Time (JIT) compiler and how it improves performance by compiling bytecode to optimised machine code at runtime. Skipping these early iterations is essential in order to get more accurate results.
Pitfalls and Blackholes

There are some pitfalls to be aware of when writing benchmarks to ensure JVM optimisations do not invalidate your results.
Dead code elimination
If you’re not careful the compiler may optimise away dead code that you are trying to measure. There are two ways to prevent this:
- You can return the field from the method, which is then implicitly consumed by a Blackhole: (code is taken from JMHSample_08_DeadCode)
private double x = Math.PI;

private double compute(double d) {
    for (int c = 0; c < 10; c++) {
        d = d * d / Math.PI;
    }
    return d;
}

@Benchmark
public void baseline() {
    // do nothing, this is a baseline
}

@Benchmark
public void measureWrong() {
    // This is wrong: result is not used and the entire computation is optimised away.
    compute(x);
}

@Benchmark
public double measureRight_1() {
    // This is correct: the result is being used.
    return compute(x);
}Baseline benchmarks can be used for comparison to ensure that your code is being run as expected. You can also look into the generated code to check that the benchmark is still working.
- Or else you can explicitly use a Blackhole to consume it: (code is taken from JMHSample_09_Blackholes)
@Benchmark
public void measureRight_2(Blackhole bh) {
    bh.consume(compute(x1));
    bh.consume(compute(x2));
}A Blackhole is a JMH class that is used to consume a value without providing the JIT compiler any information on whether the value is used afterwards. If you are only producing a single result, it is more readable to use the implicit return method.
Constant Folding
Constant folding is an optimisation technique in which the expressions are calculated beforehand to save execution time. If the result of a computation will always be the same the JVM will replace the code that does the computation with the resulting value. This can be prevented by always reading the inputs from non-final instance fields of @State objects and computing the result based on those. (code is taken from JMHSample_10_ConstantFold)
private double x = Math.PI;

private final double wrongX = Math.PI;

private double compute(double d) {
    for (int c = 0; c < 10; c++) {
        d = d * d / Math.PI;
    }
    return d;
}

@Benchmark
public double measureWrong_1() {
    // This is wrong: the source is predictable, and computation is foldable.
    return compute(Math.PI);
}

@Benchmark
public double measureWrong_2() {
    // This is wrong: the source is predictable, and computation is foldable.
    return compute(wrongX);
}

@Benchmark
public double measureRight() {
    // This is correct: the source is not predictable.
    return compute(x);
}Bench-remarkable
As part of this feed handler development testbed project we have converted a full day of market data from the NYSE Arca exchange to an in-house binary format. The aim of this project is to upskill developers on writing feed handlers, maintaining orderbooks and implementing optimisation techniques.
In this project I needed to parse the binary file, read the packet and message headers and populate message stub objects. In the first version I used a DataInputStream to wrap a FileInputStream in order to read the file, however I then tried using a BufferedInputStream instead. Shown below are some benchmarks that will compare the throughput of using a DataInputStream vs. using a BufferedInputStream.
@BenchmarkMode(Mode.Throughput)
@OutputTimeUnit(TimeUnit.SECONDS)
@State(Scope.Benchmark)
@Warmup(iterations = 5)
@Measurement(iterations = 5)
public class TestBedBenchmark {
    private static final String BINARY_FILE_PATH = "C:/Temp/MarketDataSmall.bin";
    int packetHeaderSize = 16;
    byte[] headerBuffer = new byte[packetHeaderSize];

    @Benchmark
    public void parseWithADataInputStreamWithMsgTypeAsEnum() throws InterruptedException, IOException {
        var dataInputStream = new DataInputStream(new FileInputStream(BINARY_FILE_PATH));
        while (dataInputStream.read(headerBuffer) == packetHeaderSize) {
            var byteBuffer = ByteBuffer.wrap(headerBuffer).order(ByteOrder.LITTLE_ENDIAN);
            var packetHeader = new PacketHeader(byteBuffer);
            var messageBuffer = new byte[packetHeader.getPktSize() - packetHeaderSize];
            dataInputStream.read(messageBuffer);
            byteBuffer = ByteBuffer.wrap(messageBuffer).order(ByteOrder.LITTLE_ENDIAN);
            for (int i = 0; i < packetHeader.getNumberMsgs(); i++) {
                BinaryParser.parseMessageWithMsgHeaderAndEnum(byteBuffer);
            }
        }
    }

    @Benchmark
    public void parseWithBufferedInputStreamWithMsgTypeAsEnum() throws InterruptedException, IOException {
        var bufferedInputStream = new BufferedInputStream(new FileInputStream(BINARY_FILE_PATH));
        while (bufferedInputStream.read(headerBuffer) == packetHeaderSize) {
            var byteBuffer = ByteBuffer.wrap(headerBuffer).order(ByteOrder.LITTLE_ENDIAN);
            var packetHeader = new PacketHeader(byteBuffer);
            var messageBuffer = new byte[packetHeader.getPktSize() - packetHeaderSize];
            bufferedInputStream.read(messageBuffer);
            byteBuffer = ByteBuffer.wrap(messageBuffer).order(ByteOrder.LITTLE_ENDIAN);
            for (int i = 0; i < packetHeader.getNumberMsgs(); i++) {
                BinaryParser.parseMessageWithMsgHeaderAndEnum(byteBuffer);
            }
        }
    }
}I found that closing other programs before running the benchmarks improves the results.
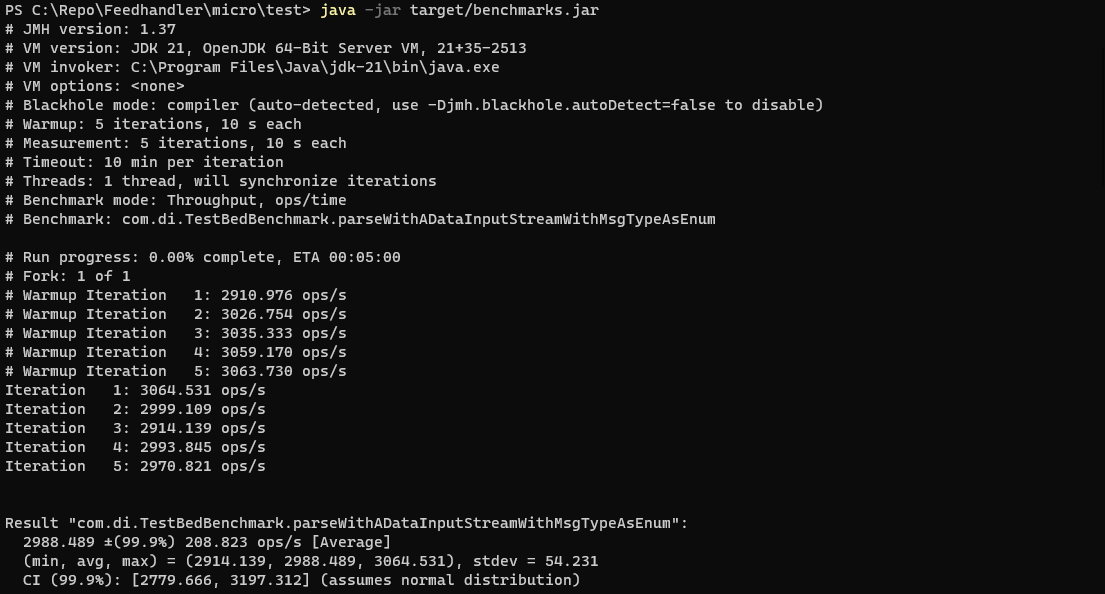
Shown below is the output from the DataInputStream benchmark:
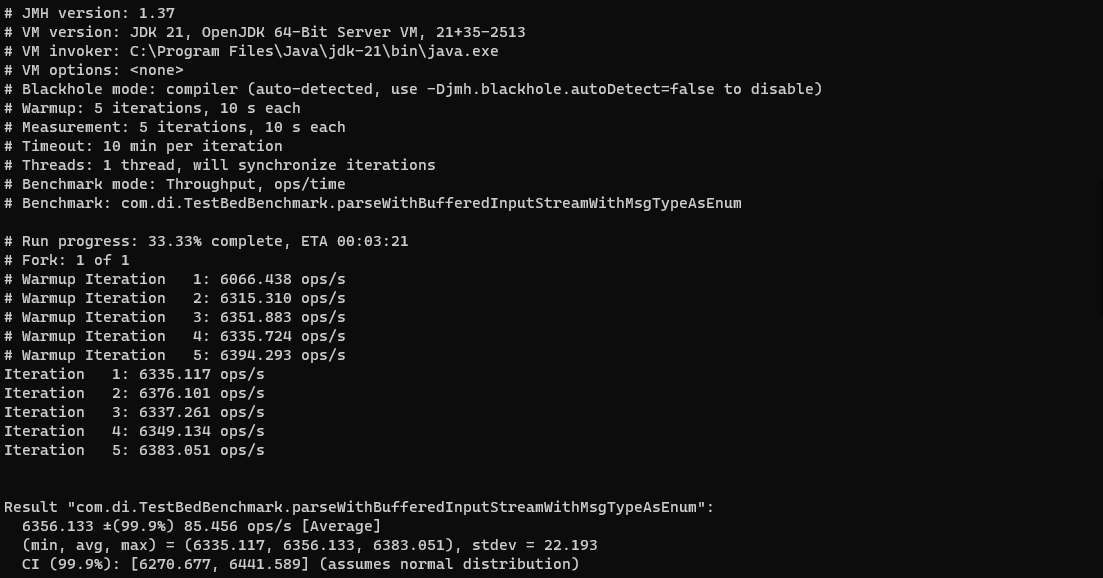
Followed by the output from the BufferedInputStream benchmark:
During the course of development I introduced enums instead of using short primitives for the messageType fields. Using micro-benchmarking we can see that, although enums have their advantages within a Java application, for this use case they do not produce the highest throughput.
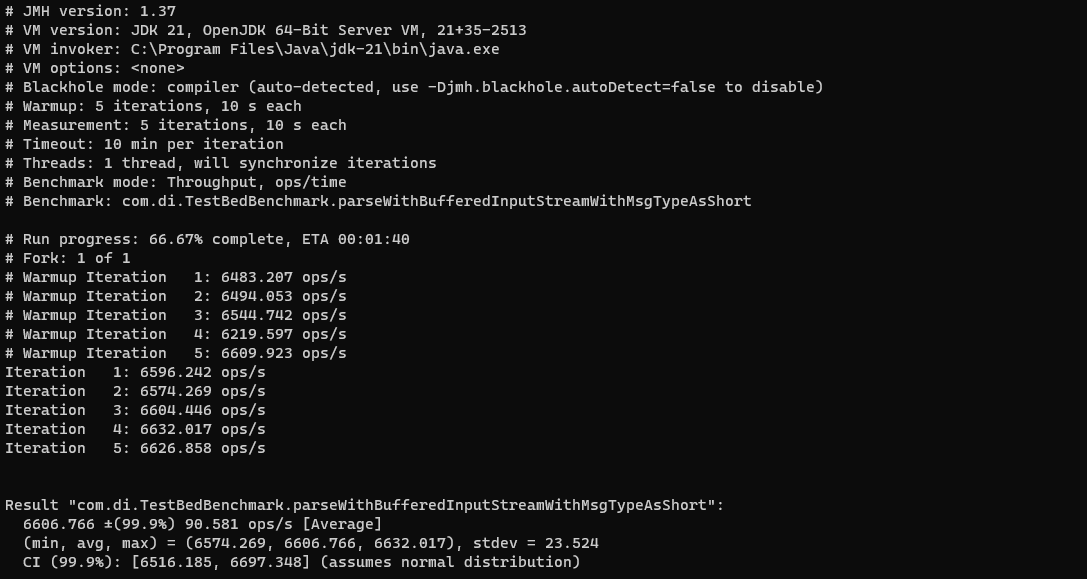
As shown in the results screenshot below, the throughput of the BufferedInputStream benchmark (6356) is more than double that of the DataInputStream one (2988), meaning that it’s over twice as fast. Also by reverting the messageType field from an enum to a short primitive we can see a further improvement in the number of operations per second (6607).

To learn more I suggest checking out the many sample files provided by OpenJDK in the JMH github repo, these are well commented and I found it a great way to familiarise myself with the tool and its features.
Share this: