Elliot Tennison
As part of a client investigation into system latency issues, AquaQ Analytics has been exploring and working on incorporating packet sniffing into kdb+ to better identify problems over a network. This blog is a case study that looks at two FIX engines interacting and how PCAP files can be used to identify possible problems. The parser deconstructs PCAP files, which consist of sniffed packets in binary, and decodes the binary into a table in a kdb+ session.
Packet Sniffing
Data is broken down into smaller units called data packets before being transmitted over the computer network. Packet sniffing is the practice of gathering, collecting, and logging some or all packets that pass through a computer network, regardless of how the packet is addressed. A packet sniffer can then be used to capture the packets being transmitted, store and organise the data. Examples of packet sniffing software include WireShark and SmartSniff.
Generating a Packet
Tcpdump, a linux command line utility, can be used to generate a packet. It will capture and save down the data as binary to a PCAP file, given the appropriate flags. Note that tcpdump does not convert the data in any way, but is merely used to capture the data.
More information on tcpdump and the available flags is available here.
Below is an example of a command line expression that is used to listen to port 2222, caps the number of packets captured at 25 and also writes the packets to a PCAP file:
10:09 aquaq@kdb:~$ sudo tcpdump -i any -c25 -nn -wwebserver.pcap port 2222
[sudo] password for aquaq:
tcpdump: listening on any, link-type LINUX_SLL (Linux cooked), capture size 262144 bytes
25 packets captured
52 packets received by filter
0 packets dropped by kernel
Security
Packet sniffing has garnered a bit of a bad reputation, being a favourite of hackers and crackers. To combat security risks, tcpdump requires elevated permissions, ensuring that sudo must be used in command line executions. However, there are benefits to packet sniffing; analysing network traffic can give an advantage to debugging problems and can also act as an early warning system to any latency issues.
Packet Structure
The main structure of a PCAP file is formed as follows:
- Global header (24 bytes)
- Packet header (16 bytes)
- Packet Data (length located in packet header)
- …
- Packet header (16 bytes)

Figure 1 is a diagrammatic representation of the structure of a PCAP file. The global and packet headers will always be 24 and 16 bytes respectively and the packet data will vary. For the example packet above, the packet data is 101 bytes. The packet header and data sections are then repeated for each unique packet in the capture. It is important to note that the packet data sections are the only components taken from the network. They follow the structure of a general data packet and therefore contain their own set of headers and meta data. The global and packet headers, on the other hand, are generated by tcpdump.
Packet Header
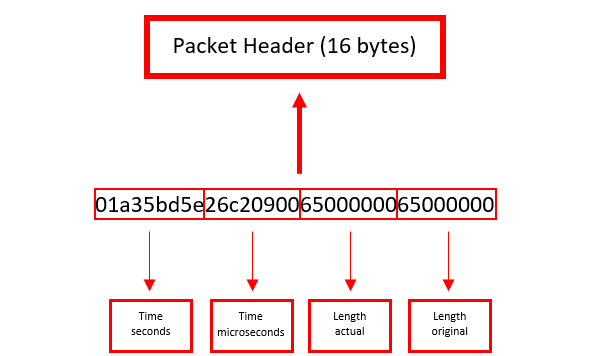
The packet header is split into 4 elements, each containing 4 bytes. Figure 2 details where each part is stored. The 4 parts are:
- Timestamp seconds (epoch)
- Timestamp microseconds (epoch)
- Length of packet data (actually captured)
- Length of packet data (length over the network)

Packet Data
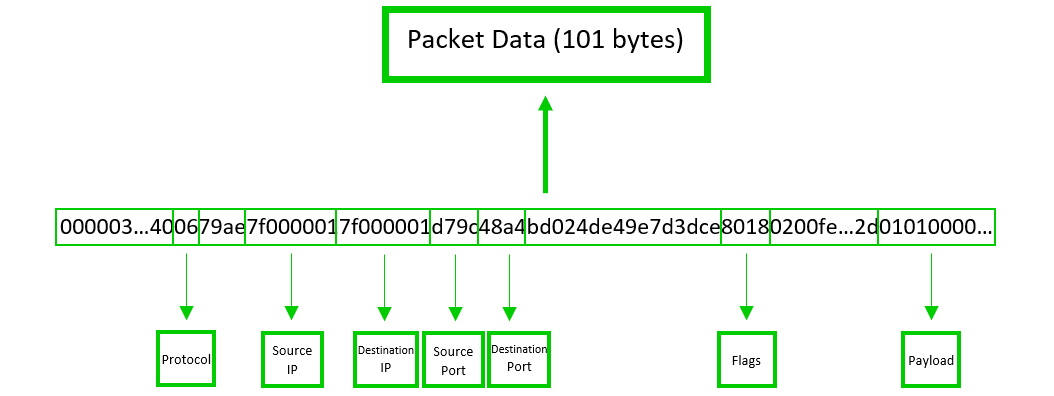
This part of the file contains information on where the packet was sent from/to, how it was sent there and much more. The end of the data packet contains the actual information that was sent over the network and it will be referred to as the payload. The payload length can be inferred by subtracting the length of the headers and metadata in the packet data from the entire length of the section.
Some examples of information found in the data packet include (see Figure 3 for locations):
- Source IP
- Destination IP
- Source Port
- Destination Port
- Protocol
- Flags
- Payload

Decoding a Packet
The kdb+ PCAP Decoder will grab these different pieces of information and convert from bytes. After iterating through the entire file, the main function will output a table containing all the information, shown in Table 1. For a more in depth demonstration of a PCAP file being decoded, visit the decoder repo.

FIX Case Study
In this case study, the kdb+ PCAP Decoder is used to analyse data sent between two FIX engines. To set up a similar case study, the FIX engine repository can be found here. The README.md file will guide you through the process of setting up a server and client.
Simple FIX messaging
First, the kdb+ PCAP Decoder is used to parse the data transferred for a single message. In this example, a simple Indicator of Interest (IOI) message is used. Table 2 shows different interactions between the FIX engines. Rows 1-3 contain the login messages, 4-7 contain the initial heartbeats and 8-9 contain the first IOI message and acknowledgement.

FIX Messaging with Blocker
Next, the kdb+ PCAP Decoder is used on a FIX engine under stress. This is achieved by first blocking the server in an error trap and then sending it a burst of IOI messages from the client. This overwhelms the server and eventually leads to a delay in the transfer of the packets. Once this has occurred, the server is then manually unblocked.
Table 3 shows the result of this blocking process. The message burst is interrupted with TCP ZeroWindow packets (packets where win value is 0) and TCP Keep-Alive packets (packets where seq number is 1 less than previous ack number). This interruption indicates that there is a problem with the data transfer.

TCP ZeroWindows are a sign that the server is being overwhelmed because they tell the client to stop sending data. This gives the server enough time to process the packets it has already received. Here the client then sends TCP Keep-Alives to check whether the server is ready to receive data again.
The cycle between ZeroWindow and Keep-Alive packets will repeat until the server is ready for more data. This is an example of TCP flow control.
Table 4 then shows the stage at which the server is manually unblocked. The RST and SYN packets, packets 403-405, reset the connection after the server is unblocked, allowing the packets to move as usual.
It is clear to see that the decoded PCAP file has provided more than enough information to follow the events of the setup and identify the issue generated.

FIX Messaging with Buffer
Next, the blocking process is repeated using different sizes for the send/receive buffers in the FIX engine configuration. These buffers alter the amount of data that can be held by the server before it is processed. All previous tests have used the default buffer value of 65536 bytes.
A sign that the server’s buffer has been filled is the production of the ZeroWindow and Keep-Alive packets seen in Table 3. The fact that the buffers are full mean that the client must stop sending data which requires sending these types of packets.
Table 5 shows the first few packets of a burst of 1000 message sent when the buffer size is 90kb. The buffer is just large enough to fit the full burst uninterrupted. The pattern seen in the table continues for the entire burst.

The effect of decreasing the buffer size to 89kb can be seen in Table 6. The message burst is interrupted with packets containing FIN and SYN flags. These flags are used to gracefully establish an improved connection between the engines as a response to the buffer nearing its capacity. In this case, the server is not overwhelmed to the point of producing ZeroWindow and Keep-Alive packets, although it is starting to struggle.

Since the packet behaviour may be identified from the decoded PCAP file, it is possible to determine the point at which the receive buffer is filled. Tables 7 and 8 show the result of sending a burst of 921 and 922 messages respectively to an 80kb buffer. Note that the FIX engines bundle multiple messages together into one packet when under strain, therefore the elements of the ‘No’ column here reflect only the number of packets being sent, not the number of messages.
Table 7 displays the same FIN/SYN packet behaviour seen in Table 6, meaning that the buffers have not been filled. On the other hand, the 922 message burst is interrupted by the cycle of ZeroWindow and Keep-Alive packets shown in Table 8. This is a clear sign that the receive buffer has been filled since the client needs to temporarily stop sending data.


Repeating the above comparison, it seems that a 100kb buffer is filled by 1112 messages and a 120kb buffer by 1301 messages. Here we see a linear relationship between the buffer size and the amount of messages required to fill it.
Here the decoded PCAP files contain not just useful data, they are providing clear signposts to the different network states. In this particular case, the risk of misdiagnosing the issue is considerable. Therefore, the insights that the decoded PCAP files have presented are invaluable.
Nagle’s Algorithm
Nagle’s Algorithm (NA) is a method of improving the efficiency of data transferred through TCP by reducing the number of packets required. This is done by only sending packets after all previous packets have been successfully acked. This allows multiple messages to be bundled into one packet and sent as one, resulting in fewer but larger packets overall. Conversely, since only one packet may be actively transported at a time while NA is applied, this can lead to bottlenecks if data is being nacked for any reason. As a result, it should be used with care.
The FIX engines may be configured to apply NA, however all previous tests have had this option turned off so far.
Tables 9 and 10 show the effect of Nagles Algorithm. Here the packets in Table 10 are part of a burst which have the method applied, the ones in Table 9 do not. It is clear to see the length of the packets in Table 10 are larger than in Table 9, excluding the ack replies. This is due to the fact that multiple IOI messages in the burst are being bundled under one packet header and sent as a single packet. As a result, there are much fewer packets when Nagles’ Algorithm is employed. This is a much more efficient way to transfer data using the TCP protocol.


Conclusion
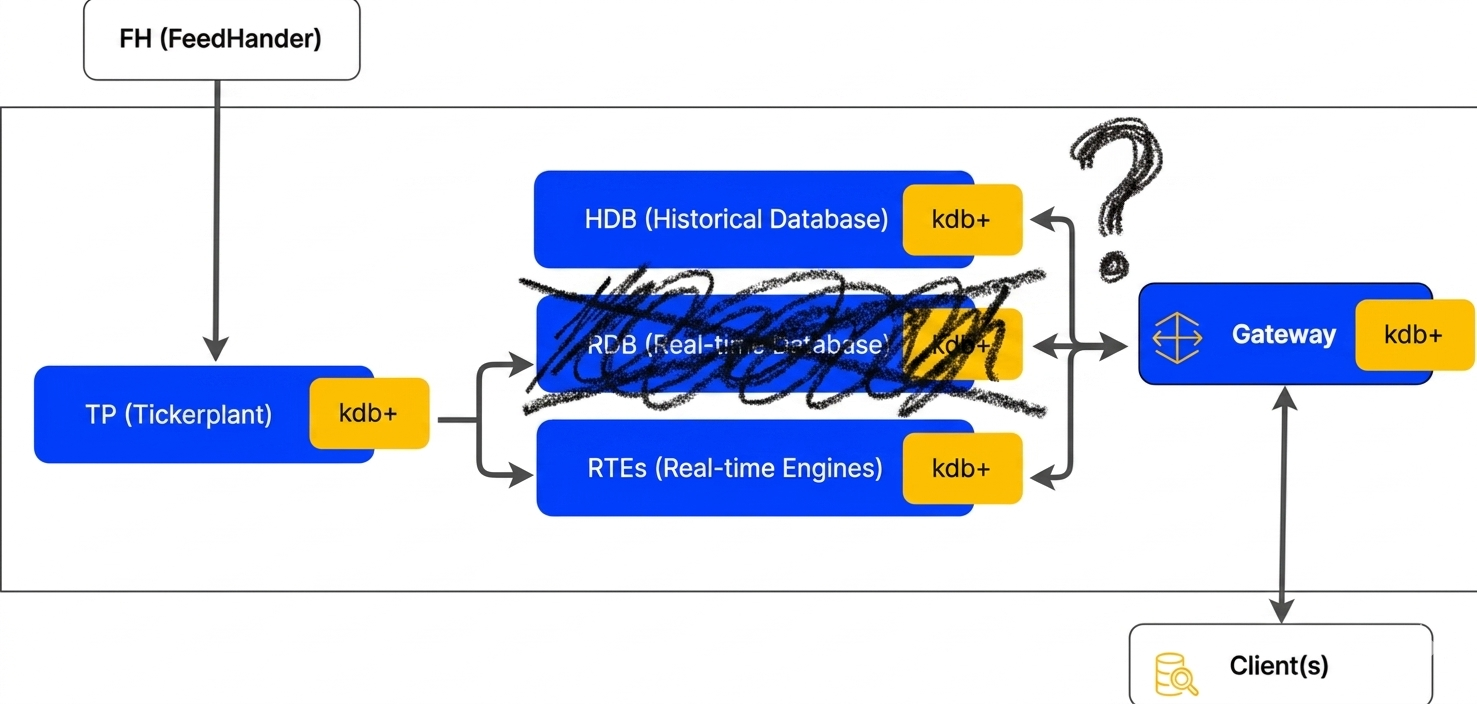
It is evident after looking at the FIX Case Study that the analysis of decoded PCAP files can provide invaluable insights into network characteristics and issues. These insights may range from using flags and other information to determine a packet’s purpose to simply observing the exact time at which a packet was received by a process. Packet sniffing being incorporated into kdb+ means that it will be easier to link up with other kdb+ systems. Therefore, these techniques can be used to debug issues historically or, with the right monitoring, show latency issues in real time. More specifically, the decoder could be used to analyse the data packets sent to and from a tickerplant to determine its status.
The decoder may be extended by incorporating extra features as well as improving its ease of use and flexibility.
The kdb-pcap-decoder repository can be found here. If you would like to find out more about this or other AquaQ projects or if you have any questions, please get in touch.
Share this:


