Benchmarks Are Only Half the Story
Jonny Press
We’ve been using the end-of-year wind down time to review some database performance benchmarks, in relation to our default domain of time series analytics within the Capital Markets space. Performance benchmarks serve as a good level set when considering a database technology, but they don’t tell the full story. The majority of queries in standard benchmarks are fairly simple, and something of a “lowest common denominator”, with a lot of focus on simple statistics (maximum, minimum, average) over different groupings and filters.
In our experience, a lot of analytics do follow this pattern, at least as the start point- aggregate the data and then do something else with it. But a lot of the more valuable analytics don’t follow this pattern, and we need to analyse across the full dataset. Some examples are:
- Asof joins, where we have to align two or more asynchronous datasets. If the database can’t do this, it’s a lot of data egress.
- Non-categorical groupings, where the grouping value is derived rather than being directly within it. A “time bar” is an example (the bar is derived from the time column), or grouping trades that occurred consecutively at the same price point.
- Orderbook analytics with Level 2 or Level 3 data where we care about every change. These data sets are huge.
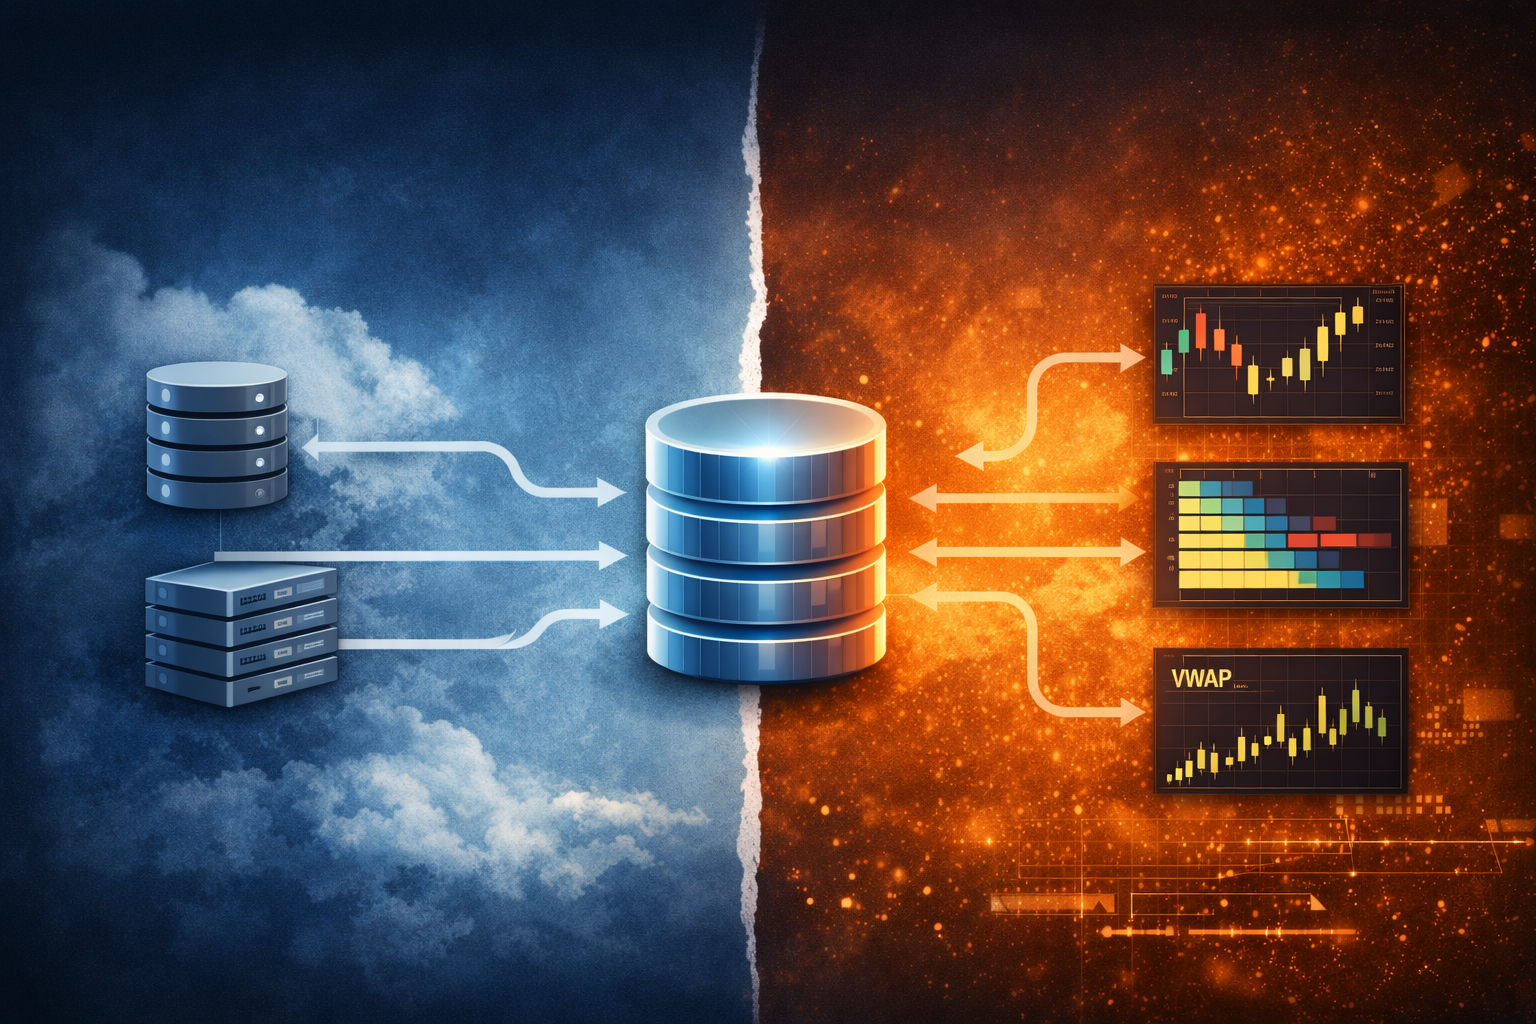
An analytics system usually looks a bit like the below- a database layer to store and manage data, an analytics layer to do the more complex transformations, and then an optional visualisation layer.

It may be possible to fully serve the analysis directly from the database layer, but it is dependent on complexity. The higher complexity work will need to be done in the analytics layer, with the most appropriate tools for the job. This makes a lot of sense, because it allows the full remit of data science tooling to be brought to bear on the task at hand.
If we think of the distribution of complexity, there is a cut-off point where we have to move the solution from predominantly in the database layer to predominantly in the analytics layer. (Note that we have no idea what shape the distribution is, but a normal-ish distribution seems as good a guess as any! The point is there’ll be a cutoff point)
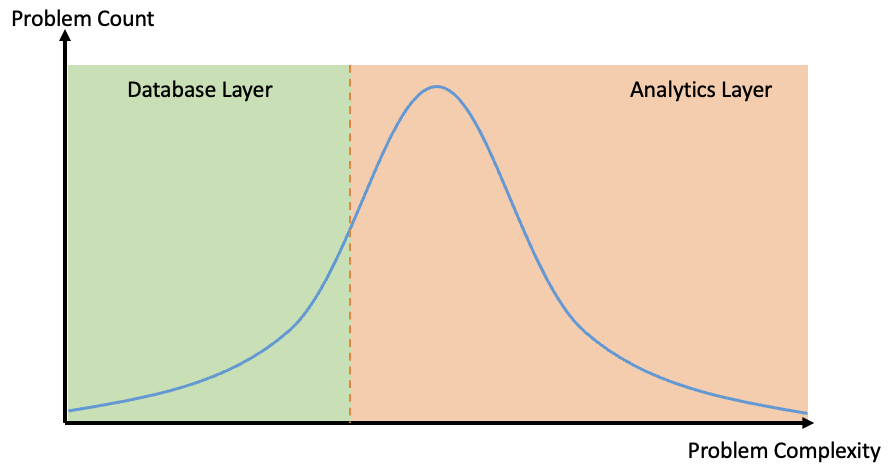
The transition serves as an inflection point. From a system standpoint it means that we have to:
- work with multiple technologies, meaning different skill requirements and managing ownership boundaries
- map datatypes between systems- timestamp handling and null semantics are two common pain points
- egress potentially significant volumes of data, leading to higher cost and latency.
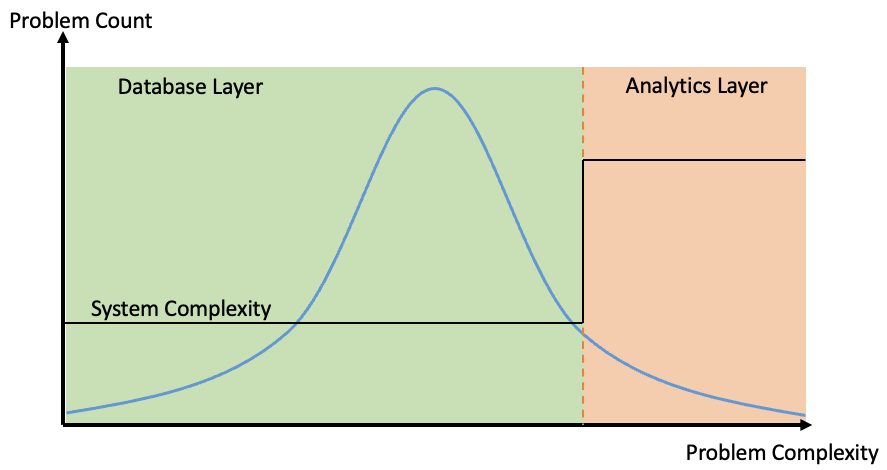
This tends to impact performance and efficiency from the standpoints of both compute and development cost. If we can move the inflection point to the right, and sensibly handle more analytic complexity within the database itself, then the resultant system is likely to perform better and potentially a lower TCO.
An Analytics Benchmark
Benchmarks are a useful baseline but they don’t tell you how simple your platform will be in production. In time series analytics, the winners are the databases that let you keep the hard work close to the data: joins, windows, feature generation. The more you can do in one place, the less you have to move and stitch.
We would love to see a time series database oriented benchmark which helps reveal the true ability for the database to handle analytic complexity. But please remember that “all benchmarks are lies”.
Share this: