Andrew Wilson

Geneos Monitoring built by ITRS
Download Qeneos
What is Qeneos?
During my career I have worked as both a Software Developer and Support Engineer. Over the years, I have learned that Geneos Active Console, part of the suite of monitoring tools built by ITRS, is an immensely powerful tool for supporting kdb+ applications. In my opinion, it is by far the best tool for monitoring large kdb+ frameworks. This is primarily due to its layered approach and the dynamic functionality that can be built as a result. Geneos gives developers and support engineers a structured interface, a highly configurable layout and intuitive alerting for their systems. The larger your kdb+ application grows, the more invaluable Geneos becomes.
The software does come with an initial learning curve for new users. I’ve witnessed, at least in the kdb+ world, a relatively long setup time as developers and support wrestle with countless other tasks before an application goes live. This can lead to a headache for management – who builds the monitoring on Geneos?
From my personal experiences, the bulk of Geneos knowledge frequently lies with the Support or Operations teams. Conversely, the majority of kdb+ expertise and knowledge of the application’s upcoming features belongs to the developers. This is particularly true in institutions where the Support teams work across several applications, in multiple different programming languages. So unless every institution is willing to hire a brand new team of Geneos savvy, kdb+ trained Support Analysts (if you are, then please get in touch), then setting up an all-encompassing Geneos monitoring system is likely going to be a time-consuming and complicated endeavour.
At least, until now…
What have we done?
AquaQ Analytics have created a kdb+/Geneos integrated framework. This will allow users to programatically generate a Geneos Active Console XML for their application. Instead of creating each Managed Entity, Type, Sampler, Rule, Active Time and Process Descriptor separately, the user can populate a few simple csv files with variables and q queries and a script will populate and import the output to a Geneos includes file. No prior knowledge of Geneos or the ability to write in XML is required. The package comes with several predefined samplers. These should be useful in looking at time series data in a kdb+ application. While originally designed on a TorQ framework, the Qeneos XML builder comes with instructions on how to configure it for use with other frameworks.
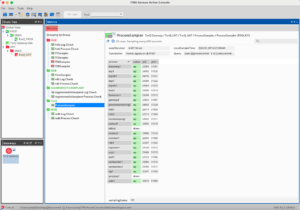
Overview of our Qeneos Generated monitoring system
What features does it have?
In our first version we prioritised the basics. The initial goal was to create a product as close to plug-and-play as possible, with a priority on adding value to any user in the minimum time possible. Releasing this initial version gives us the opportunity to listen to anyone interested in the framework, and we can then continue our development to meet users needs.
Version 1 of Qeneos boasts the following features:
- Ability to build a Geneos XML including Managed Entities, Types, Samplers and Static Variables using a single command.
- Short scripts allowing for q queries to be run as part of a Geneos sampler.
- Genuinely achievable, day 1, real time monitoring for a kdb+ system.
- A set of tried and tested methodologies on which to begin supporting a kdb+ application.
- Comprehensive instructions on how to set up and develop your kdb+ Geneos setup.
- A flexible approach, allowing users to choose between using the XML builder as a starting point before handing over to a support team, continuing to use it as a development driven Geneos configuration or using it in tandem with their current Geneos configuration.
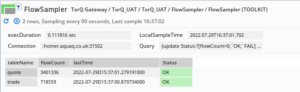
A sampler showing the data flows of a trade and quote table produced by AquaQ’s TorQ finance starter pack.
How does it set up your Geneos?
While everything is configurable and you can structure your Geneos however you see fit, we have created the recommended model below:
- Managed Entities – One per data flow (TP -> RDB -> HDB). This is best practice so you can consider all the processes involved in each data flow together and easily identify from a glance where problems in your system might be located.
- Types – One per Process.
- Sampler – We have included 3 types of samplers. Geneos’s FKM and Process samplers, and the toolkit sampler pointing to our own generic kdb+ sampler.
- Rules – The best practice we’ve found is to set the conditions for alerting in the sampler itself. Each generic sampler should have a ‘Status’ column with values: OK, Warn or Fail. As the rules are the most difficult bit to automate, a generic rule that looks at Status columns in all samplers is included.
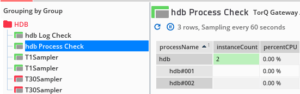
A sampler showing some of the stats of two hdb processes running within our system.
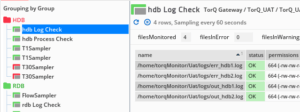
A sampler that scrapes the logs of the two hdb processes running in our system
A deeper look at the Geneos sampler scripts
One of the simplest, but most powerful parts of the XML builder framework is the ability to turn a kdb+ query or function into a geneos sampler. Anything that can be coded to return a table can be added to your Geneos.
We achieve this with a combination of q scripts. The first is designed to isolate the process you’re trying to connect to and return the connection details. The second is programmed to run your q query against the particular process and convert it into a Geneos-readable output. This is neatly wrapped in a single bash script, allowing it to be easily configured into existing monitoring systems and the TorQ framework.
Our Geneos Philosophy
From years of experience and collaboration, I have outlined my personal methodology and approach to building a Geneos monitoring system for a kdb+ application:
- Let your Geneos read like a data flow – start with hardware monitoring and the discovery process, then any monitors on your feeds and tickerplants, working your way down to monitoring historical data on disk. Arranging things in this way allows for you to pinpoint the first point in your kdb+ architecture where something has gone wrong. This limits investigation time and helps simplify issues into more manageable segments for any debugging activities.
- Scrolling and clicks are bad! – When creating a Geneos sampler, try to avoid the extremes in terms of size. Having too many small samplers will require lots of mouse-work to navigate and if scheduled downtime occurs, snoozing will get tiring very quickly. Conversely, a sampler that has 35 columns and 120 rows will require a lot of scrolling just to find a single alert. We aim to set up somewhere in the middle – grouping each type of process together and limiting the size of our sampler tables. By integrating q queries into our XML builder, it will be easy for proficient kdb+ users to expand or reduce their result sets to give the best view.
- Be strict with your alerts! – When supporting a very large kdb+ application, your Geneos can very quickly grow out of control. If you find yourself consistently ignoring red alerts, you probably need to relax your rules in order to keep your Geneos maintainable. Where possible, I recommend trying to make your setup as dynamic as possible. This can be achieved by configuring the generic sampler to create a conditional status column. In the example below we uses trends in the historical data to ascertain the acceptable thresholds each day.
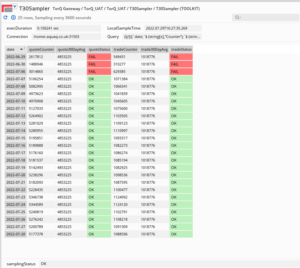
A look at 30 days of historical data volumes in our TorQ HDB
Conclusion
Building Qeneos version one has been a lot of fun and a great learning experience for us at AquaQ. We’re hopeful that this will prove a useful tool to Geneos and kdb+ users and that we can continue developing the product. The enhancements on the horizon include Commands, Actions, Authentication and Exported Data, as well as integrating it with some new monitoring features we are developing for AquaQ’s TorQ framework.
Ideally though we want to be building things that benefit you! If you have any feature requests, have found bugs or just fancy a chat and some more information about supporting your kdb+ application with Geneos Active Console, please bombard us with emails, comment on our social media or get our attention in any way you see fit.
If your organisation has access to Geneos then please try downloading Qeneos and giving it a try!
AquaQ are always looking for talented individuals to work in both their support or development streams. Please check out our available opportunities if you’re interested in joining the team.
Share this: