Data Intellect
In a previous post we identified the reasons we chose kdb+ in the Internet Of Things application that we developed. This blog discusses which features we utilized in our Clinical Trail Costing Application, again built on our TorQ Framework, incorporating node.js and making kdb+ behave a bit like a document store. If you would like a demonstration of the product please get in touch.
We were approached about building an application to provide cost analysis for clinical trials, and off the back of it we started our AquaQ Clinical venture. We chose kdb+ as the base technology due to the performance, flexibility, expressive language with rich temporal operators, and the resultant simplified architecture.
At a basic level a clinical trial consists of:
- a protocol (a series of steps to follow, such as “patient gets injection on day 1, gets blood test on day 5” etc.)
- a set of sites, which enrol at different times and in different countries, to run the trials
- a set of patients who enrol in the trial on different days
Each step of the protocol has a cost associated, which varies per site. Each site has their own costs associated with hosting the trial, which are payable after different time periods. Each patient has an associated drop out rate. The problem of calculating the projected cost profile over time for a single trial isn’t hugely complicated, though it’s also not trivial. The method currently used is largely spreadsheet based, meaning that
- there is no ability to roll up costs to aggregate views
- there is no or limited ability to track versions of plans
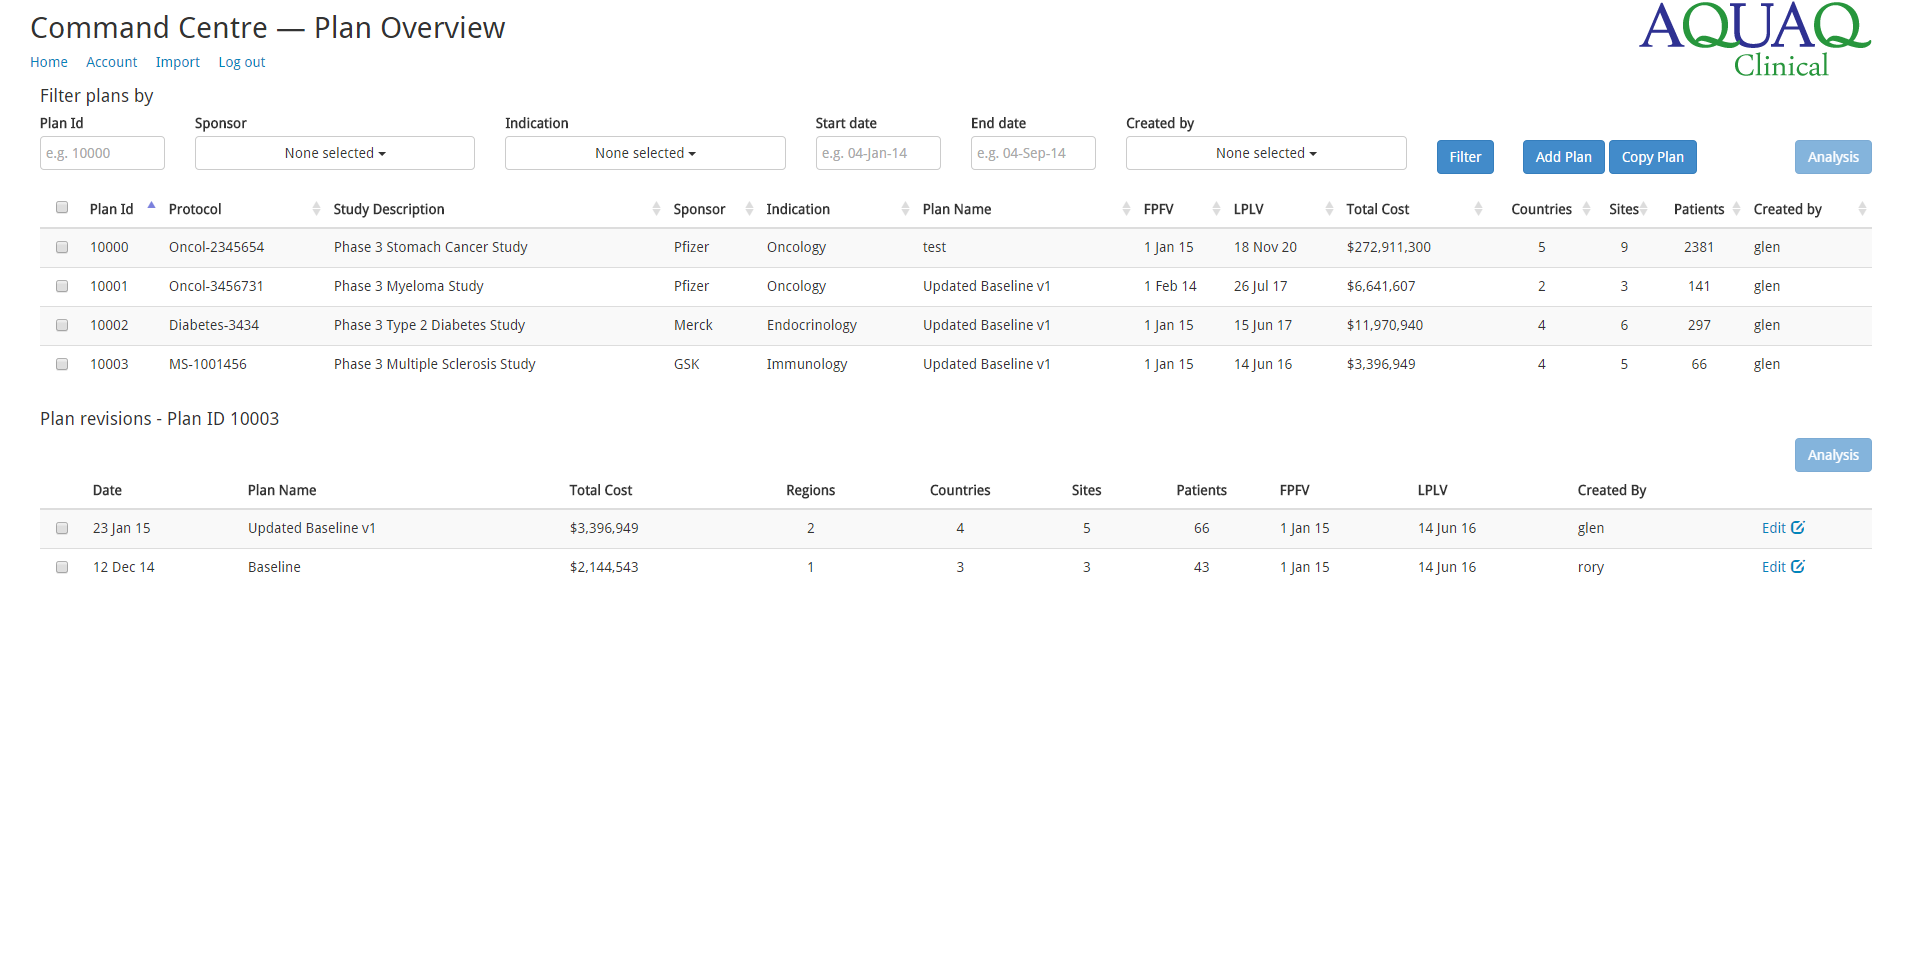
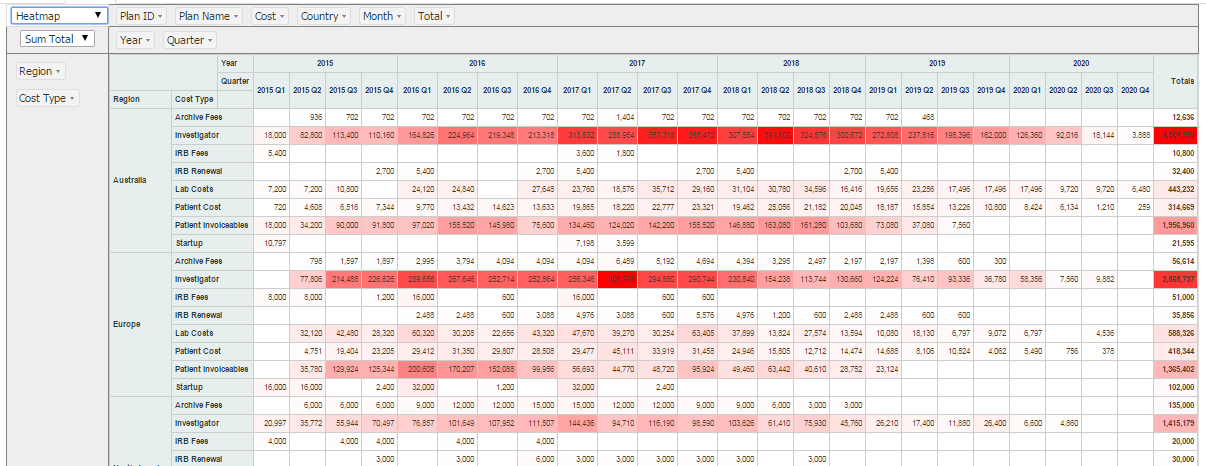
The application we built allows both of the above. Users can compare different versions of plans and why the projections have deviated, and can aggregate up costs by different dimensions (e.g. sponsor, trial type etc.). We also cater for “what if” analysis – how changing certain variables changes the overall costs. We built an HTML5 front end for the application. Some sample screens are shown below.
HTML5 front ends can be connected directly to kdb+ as it supports websockets. For security reasons through we decided to add in a separate webserver (node.js). However, because we can run all the analysis within the database, and the database can respond with JSON output, the webserver is little more than a relay. The system architecture looks like this:
A neat trick that kdb+ has up its sleeve is how the trial data is stored. Each trial is broken down into different components which are stored separately- protocol, site details, patient sign ups etc. The protocol costs for a single patient in a specific country might look like this:
milestone investigatorcost patientcost patientinvoiceables forecastpayment
--------------------------------------------------------------------------
Screening 4250             250         3250                2950
Baseline  3150             250         0                   0
Cycle 1   2000             250         0                   0
Cycle 2   2000             250         3250                0
Cycle 3   2000             250         0                   0
Cycle 4   2000             250         3250                0
Cycle 5   2000             250         0                   0
Final     2000             250         3250                0
The protocol can change over time in multiple ways- new milestones can be added or deleted (rows added or removed) and new costs can be applied (additional columns). Rows being added or removed is simple, additional costs are more complicated as this necessitates a schema change. We also want to track all revisions to the protocol to allow us to retrieve historic valuations. There are different ways to do this, but a nice simple approach which kdb+ allows is to serialize the protocol table object and store it as a timeseries. This means that kdb+ starts behaving a little like a document store- similar to mongoDB.
// two different versions of the protocol
q)show prot1
milestone investigatorcost patientcost patientinvoiceables forecastpayment
--------------------------------------------------------------------------
Screening 4250             250         3250                2950
Baseline  3150             250         0                   0
Cycle 1   2000             250         0                   0
Cycle 2   2000             250         3250                0
Cycle 3   2000             250         0                   0
Cycle 4   2000             250         3250                0
Cycle 5   2000             250         0                   0
Final     2000             250         3250                0

q)show prot2
milestone investigatorcost patientcost patientinvoiceables forecastpayment equipmentcost
----------------------------------------------------------------------------------------
Screening 4250             250         3250                2950            200
Baseline  3150             250         0                   1000            200
Cycle 1   2000             250         0                   1000            200
Cycle 2   2000             250         3250                1000            200
Cycle 3   2000             250         0                   1000            200
Final     2000             250         3250                1000            200

// serialize them and store in a protocols table
// -8! is serialization
q)protocols:([]date:2015.11.01 2015.11.15;studyid:1 1;prot:-8!'(prot1;prot2))
q)show protocols
date       studyid prot                                                      ..
-----------------------------------------------------------------------------..
2015.11.01 1       0x01000000410100006200630b00050000006d696c6573746f6e650069..
2015.11.15 1       0x01000000550100006200630b00060000006d696c6573746f6e650069..

// to retrieve the protocol at a given point in time, e.g. 2015.11.10
// -9! is de-serialization
q)-9!exec last prot from protocols where date<=2015.11.10,studyid=1
milestone investigatorcost patientcost patientinvoiceables forecastpayment
--------------------------------------------------------------------------
Screening 4250             250         3250                2950
Baseline  3150             250         0                   0
Cycle 1   2000             250         0                   0
Cycle 2   2000             250         3250                0
Cycle 3   2000             250         0                   0
Cycle 4   2000             250         3250                0
Cycle 5   2000             250         0                   0
Final     2000             250         3250                0
It’s also straight forward to calculate a per-milestone cost for each protocol, irrespective of the number of columns. This highlights the flexibility of the language.
q)select milestone, cost:sum 1 _ value flip prot1 from prot1
milestone cost
---------------
Screening 10700
Baseline  3400
Cycle 1   2250
Cycle 2   5500
Cycle 3   2250
Cycle 4   5500
Cycle 5   2250
Final     5500

q)select milestone, cost:sum 1 _ value flip prot2 from prot2
milestone cost
---------------
Screening 10900
Baseline  4600
Cycle 1   3450
Cycle 2   6700
Cycle 3   3450
Final     6700
There are other ways to store these datasets, but the serialization approach works nicely in cases where:
- there isn’t a huge volume of data or number of changes
- schema flexibility is required (and you don’t want to have the complication of dealing with name/value pair style formats)
- searching on the contents of the data is not required- other fields are used to search (such as time, id etc.)
Hopefully these blog posts have helped demonstrate the power and flexibility of kdb+. If you have an application that you need help implementing, or you need some training, please get in touch!
Share this:


