Data Intellect
Many financial institutions use kdb+ tick to capture and store market data. The same technology stack can be used to capture, store and analyse other forms of real time streaming data including sensor data from manufacturing production lines, usage data from utility smart meters, or telemetry data from Formula 1 cars.
At AquaQ we provide onsite and nearshore 24/7 support for a variety of clients who use kdb+ tick for market data capture, including leading investment banks and hedge funds. In this blog, I summarise the components of kdb+ tick and discuss issues to be aware of from a system support perspective when running kdb+ tick in a production environment.
What is kdb+ tick?
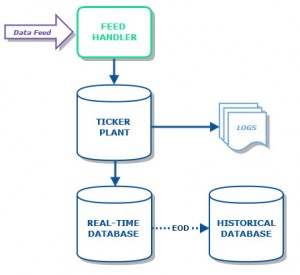
kdb+tick is an in-memory and on-disk database system which facilitates the streaming, capture and storage of high-speed real-time data for immediate analysis. It will also automatically historicise the data. That sounds great, right? The advantages that this type of system can bring a business in any sector are easy to imagine. But how does it work? Well, let’s start with an overview of what a typical installation looks like and go through what each component does.
Feed Handler: The role of the feed handler is to listen to a data feed and process any updates, before sending them on to the ticker plant. Processing in the feed handler is typically converting data fields to a more convenient type or removing extraneous information. Basically, the feed handler’s role is to map the input data, whatever it may be, into the format required by the ticker plant. Real life examples of data feeds include market data retrieved from an exchange, sensor data from a manufacturing production line, call records from a telecommunications provider and even telemetry data from a Formula One car.
Ticker Plant: The ticker plant is a process which receives ticks from the feed handler and publishes them to any subscribed process e.g. a real time database (RDB). Note that the ticker plant is not a data store; updates from the feed handler are only present in the ticker plant for a short period of time.
Real-time Database (RDB): This is an in-memory kdb+ database storing all the “current” data, which can be queried in real time. “Current” data is usually the current calendar day, though can be for shorter or longer periods depending on application. An installation may have multiple RDBs subscribed to a ticker plant to enable load balancing through the use of a gateway. In such a setup, if one RDB is busy dealing with a query, the gateway can route the next query to another RDB.
Historical Database(HDB): At end-of-day, the ticker plant sends an EOD message to all clients at which point the RDB saves its intra-day data to a historical database (HDB). Historical databases are usually partitioned by date, increasing the efficiency and response time of queries. They can also be partitioned by year, month or integer. It is common to run multiple HDB processes and to load balance across them using a gateway.
But what happens if a part of the stack fails? Good question. The answer depends on which element goes down. Let’s look at each case in a little detail…
RDB Failure
The RDB can be recovered from an intra-day failure quite easily. The ticker plant writes all updates to a log file. The RDB subscribes to the ticker plant and uses the log file to replay the current day’s data upon restart. As such, the only effect of an RDB failure is the unavailability of the database for a short period of time. The period of time depends on how late in the day a failure occurs; the later in the day that the RDB is restarted, the longer it will take as the data in the ticker plant log file may have reached many gigabytes in size.
Ticker Plant Failure
The ticker plant is a very light weight and stable component. However, if it were to fail, the rest of the system will stop receiving updates. In a standard set-up like the one shown above, data will be lost unless it can be recovered upstream from the source. However, in a typical setup, the data capture system is usually mirrored to negate the risk of ticker plant failure. Clients can switch to this backup in the event of a failure.
Historical Database Failure
As was the case with RDBs, an HDB can be recovered simply by restarting the process with the only consequence again being that users will be unable to query the database for a period of time. Since the HDB is simply data stored on disk, the down time during a HDB restart after any failure should be minimal.
Performance Characteristics
Given the distinct role that each process in the system has, it follows that they have distinct performance characteristics also. Below, we consider the CPU and memory for each, using the capital markets industry as an example (we will assume that the data flow is highest between 7am and 5pm each day). The graphical representations are for approximations only. See our memory management blog post for details on how kdb+ manages memory.
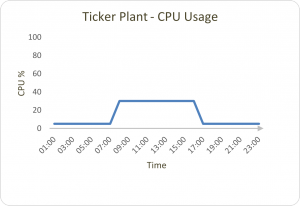
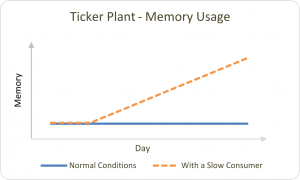
The ticker plant only uses CPU when data is being inserted. The CPU usage should remain at a fairly constant level when it is receiving data from a feed during typical trading hours, and be minimal outside of these periods.
As mentioned earlier, the ticker plant is not a data store and updates are only present here for a short period of time. As such, memory usage is usually very low even during peak trading hours. The exception to this is when we have a slow consumer incident where the updates being published become backed up in the ticker plant, causing memory usage to rise.
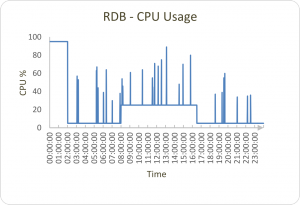
An RDB will receive updates throughout trading hours, causing CPU to maintain a mostly constant level depending on the volume of data. Outside of trading hours, CPU usage will be much lower except for at end-of-day save down when it will usually reach its peak. There will also be spikes in CPU usage as users query the real-time database throughout the day; the size of the increase in CPU usage will be proportional to the query.
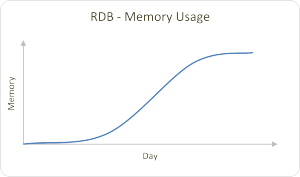
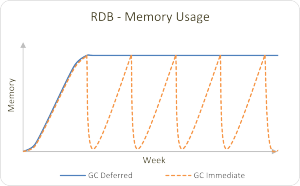
Memory usage will naturally increase in the RDB as it receives updates throughout the day. If we step back and look at a weekly representation, we can see how this cycles under two different memory management methods (or alternatively if .Q.gc[] is called after the end-of-day job is complete).
In the case of the HDB, both CPU and memory usage will be minimal except for varying spikes throughout the day caused by user queries. The level a spike reaches again depends on the query and the volume of data it needs to access/return, and the residual memory usage will be dependent on the memory garbage collection policy.
Logging
Logging client queries is required for many reasons, but not incorporated into a standard kdb+tick set up. Our AquaQ TorQ framework provides an excellent basis for a production kdb+ system which allows usage logging to be carried out very easily. Extensive logging which includes opening/closing of connections, queries and timer usage are all automatically logged to a text file and periodically rolled.
Common Problems
Two words…slow consumers. They don’t sound good, do they? They aren’t. In some cases, a client which has subscribed to a ticker plant may not be handling the data it is being sent quickly enough. This has a knock on effect where the data is buffered in the ticker plant, resulting in the ticker plant memory usage building. As mentioned earlier in the post, a ticker plant failure is difficult to recover from so anything that uses its resources in a way which may lead to one is something that must be avoided.
Another common problem in a standard set up is that during the end-of-day save down, users are unable to query the RDB. Depending on the amount of data to be saved, this unavailability of the RDB may last a while.
Help Me!
Fortunately, we do not just know the common problems and drawbacks that exist with a kdb+ data capture system, we also know how to handle them! If you need help with any kdb+ setup, troubleshooting, removing the end-of-day save outage or any aspect of data capture management and processing whatsoever, you can contact us here at AquaQ Analytics and we’ll get you up and running in no time.
Or, if you are interested in learning more about q, the underlying programming language of kdb+, you should check out our new free training taster course here.
Share this:

