Data Intellect
We are delighted to announce release v3.4 of TorQ, the latest instalment of our kdb+ framework; which can be found here. The main changes are outlined below.
Grafana Adaptor Integration
As part of this update we have included AquaQ’s recent release, the Grafana-KDB adaptor. With this inclusion, the adaptor script is loaded in to all TorQ processes, allowing connection via a Grafana session. Full installation & usage can be found in the original blog and TorQ documentation.
Once installed, a data source can be visualised by connecting it in the “add new data source” panel of Grafana; simply enter the port number and define the type as simple JSON. This now works with both real-time and historical data.
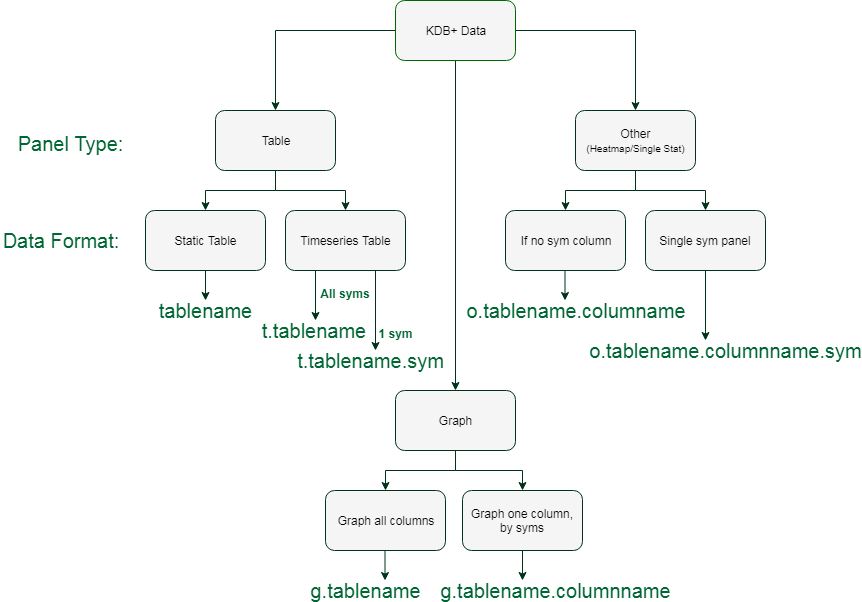
Our adaptor currently dictates the visualisations available to the user via drop-down menus on the Grafana side. The possibilities of these visuals can be seen in this flowchart of options:

User-defined variables allow flexibility in the data & visualisations. We intend to further expand these features with the addition of function calls. An example of the final output from the adaptor can be seen here:


Monit Integration
Monit is a small open-source utility for monitoring and managing UNIX systems. Monit’s ease of use makes it the perfect tool for tracking the status of TorQ processes. This addition to TorQ allows monit config files to be produced based upon the contents of the process.csv file. The full set-up can be found in the documentation.
In short, the configurations can be created in ${TORQHOME}/monit/bin/ and then executed:
- bash monit.sh generate all – to generate all the config files
- bash monit.sh generate alert – to generate the alert configuration file
- bash monit.sh generate monitconfig – to generate the monitconfig.cfg
- bash monit.sh generate monitrc – to generate the monitrc file
Monit can then be started by executing [code] bash monit.sh start[/code]
Start Script Improvements
As mentioned in the v3.3 blog the torq.sh script can be used to start or stop processes separately, in a batch or all at once. v3.4 adds further functionality to this script with the addition of 3 more added options.
Firstly, debug mode can be accessed directly via:
$ ./torq.sh stop rdb1
16:18:28 | Shutting down rdb1...
$ ./torq.sh debug rdb1
16:18:33 | Executing...
with the requirement being that the process is down before entering debug. On top of this, print functionality has been added to this script to allow:
$ ./torq.sh print rdb1
Start line for rdb1:
nohup q /TorQDemo/deploy/torq.q -stackid 14400 -proctype rdb -procname rdb1 -U /TorQDemo/deploy/appconfig/passwords/accesslist.txt -localtime 1 -g 1 -T 3 -load /TorQDemo/deploy/code/processes/rdb.q -procfile /TorQDemo/deploy/appconfig/process.csv </dev/null >/TorQDemo/deploy/logs/torqrdb1.txt 2>&1 &This then prints the start line of the process using the information provided in the process.csv.
The final addition to this script is the ability to directly qcon into any process via:
./torq.sh qcon procname username:passwordfor example:
~$ ./torq.sh qcon rdb1 username:password
Attempting to connect to rdb1...
:5802>tables[]
`heartbeat`logmsg`quote`quote_iex`trade`trade_iex
A key benefit of this is being able to refer to processes by name, removing the need for port numbers. A caveat to this is the requirement to declare both the rlwrap and qcon paths in setenv.sh, as they vary from system to system.
Service Layer
We’ve added a Service Layer. Up to this point, an application built and deployed on TorQ was in two separate parts: base TorQ, and the application specific customisations. We have been working on several client engagements where multiple separate applications have been built on TorQ. It has become clear that a third layer is required, to capture client specific TorQ customisations which are deployed across all applications. We have called this the Service Layer. A deployment which utilises the optional Service Layer can be structured as:
- TorQ: Core TorQ functionality
- Service Layer: common customisations across all applications. Examples would be client specific integration to authentication and entitlements systems, or common monitoring utilities
- Application Layer: customisations specific to the application
All code and config is loaded in the above order, meaning application layer customisations override service layer modifications which overrides core TorQ functionality.
If you are working with kdb+ TorQ, we welcome your feedback for future development so please get in touch!
Share this:


