SEMO-Downloader TorQ App
Data Intellect
The TorQ-SEMO downloader is an application which is built upon the TorQ framework in partnership with The Electric Storage Company. It allows users to download and store data relevant to electricity production for the island of Ireland. The app can be used to perform bespoke analysis on electricity market data sourced from the SEMOpx API and weather data obtained from the Tomorrow.io API (formerly known as ClimaCell). The app also includes a front-end component created using Grafana dashboards and AquaQ’s kdb Grafana adaptor. Further instructions for downloading and installing the app can be found on the github repository here .
The Single Electricity Market is the wholesale electricity market for the island of Ireland. SEMOpx provides day-ahead and intraday electricity market trading for NI and ROI as part of the Single Electricity Market. Tomorrow.io is a weather intelligence platform which provides real-time forecasts to customers around the world.
The Electric Storage Company‘s data analytics team are using this package to develop algorithms that allow their PARIS (Predictive Analytical Renewable Integration System) platform to manage geographically dispersed power units efficiently and maximise revenue based on environmental factors at these units’ geographic location including forecasts on localised generation and energy consumption.
Data Structure
SEMOpx Data
The SEMOpx API allows us to collect a variety of data from ETS market results to weather forecasts. We can download 5 different reports for analysis. These can then be formatted into 6 different tables. The following summary table displays the reports loaded in and their corresponding tables:
| Report ID | Report Name | Corresponding Table(s) | kdb+ Table Name |
| EA-001 | ETS Market Results | Index Prices Linear Orders Complex Orders |
indexprices linearorders complexorders |
| BM-009 | Annual Load Forecast | Load Forecast | loadforecast |
| BM-010 | Daily Load Forecast | Load Forecast | loadforecast |
| BM-013 | Four Day Aggregated Rolling Wind Unit Forecast | Four Day Aggregated Rolling Wind Unit Forecast | fourdayaggrollwindunitfcst |
| BM-025 | Imbalance Price Report | Minimum Imbalance | imbalancepricereport |
The Index Prices table contains index price data for the Day Ahead, Intraday-1, Intraday-2 & Intraday-3 auctions. The times stated for these markets are all in UK time. The Day-Ahead Market is a daily auction starting at 11:00 each day. In this auction, electricity is traded in 24 one-hour Trading Periods starting at 23:00 that evening and finishing at 23:00 the following day. The first of the intraday markets is the Intraday-1 auction which is a 24 hour trading period between 23:00 and 23:00 .The second of these, the Intraday-2 auction operates on a 12 hour trading period between 11:00 and 23:00. Both these auctions are coupled with a GB bidding area but the Intraday-3 auction operates only on a 6 hour trading period between 17:00 and 23:00. All of the intraday auctions use 30 minute time intervals compared to an hour for the Day-Ahead market. The ETS Market Results report, which this table is formatted from, is published once daily for the prior trading day, excluding weekends.
Both Linear & Complex Order types are downloaded into tables that share the same schema, presenting data on given orders including their quantity, settlement currency, the member who made the order, the portfolio it was under and the auction it corresponded to.
The Load Forecast table contains the daily & annually predicted electricity load forecasts for ROI, NI and their aggregate; the kdb-formatted tables contain a column which indicates whether a given forecast was made in an annual or daily report. The report containing the annual predictions (BM-009) is published in August, and contains forecasts for the coming trading year. The report containing the daily predictions (BM-010) is published every four calendar days and contains electricity load forecasts for the following four days.
The Four Day Aggregated Rolling Wind Unit table contains the Forecasted Aggregate Output (MW) across all Wind Units in each jurisdiction, for the next four trading days. This table is obtained from the BM-013 Report, which is published four times daily every 6 hours.
The Minimum Imbalance table contains data related to the calculation of the imbalance price for a given imbalance pricing period and is published following the end of its calculation. The Imbalance Price is used to settle energy imbalance volumes, where there is a difference between the amount of power required and the amount of electricity contracted.
Tomorrow.io Data
The tomorrow.io platform allows us to store real-time observed and forecasted weather data. In order to receive data, the user must first register for the tomorrow.io API key on the tomorrow.io website. To allow for comparison with the SEMOpx data we will set our location to be on the island of Ireland, however by amending the lonlat.csv we can receive data from other locations. The tomorrow.io API provides about 60 different fields of weather data. The SEMO-downloader app selects 16 of the core fields and formats them into a weather table on the RDB .The full list of the fields included in our table is shown below:
| Column Header | Description |
| time | Timestamp |
| sym | Weather Cluster |
| lat | Latitude of your location |
| lon | Longitude of your location |
| temp | Temperature |
| feels_like | The temperature as perceived by humans. This can be affected by relative humity and windspeed as well as the air temperature |
| wind_speed | The atmospheric quantity caused by air moving from an area of low pressure to an are of high pressure |
| wind_gust | The maximum brief increase in windspeed |
| surface_shortwave_radiation | The power per unit area received by the earth from the sun in the form of shortwave radiation |
| precipitation | The amount of precipitation that falls over a period of time |
| cloud_cover | The fraction of the sky obscured by clouds |
| precipitation_type | The categories of precipitation such as the phase of the cycle |
| sunrise | The time of the first appearance of the sun on the horizon |
| sunset | The time of the last appearance of the sun on the horizon |
| forecasttype | Whether the data was observed or forecasted |
| precipitation_probability | The chance that at least some level of precipitation will occur in our location |
Dashboard
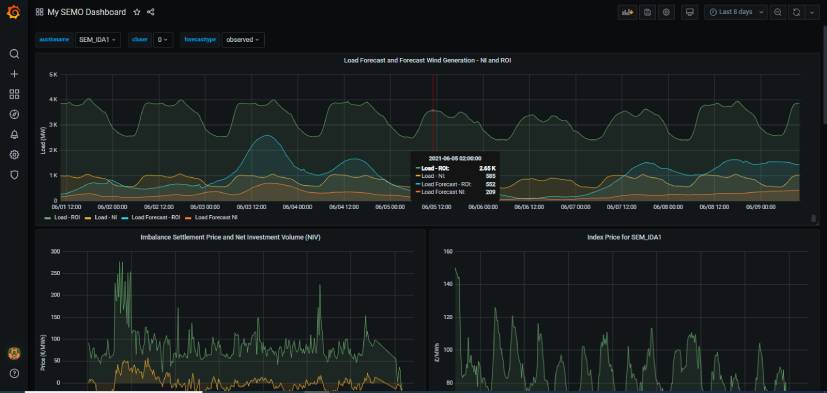
We can make use of the kdb-Grafana adaptor to query and display results from the HDB in the form of a Grafana dashboard. A JSON file for the SEMO dashboard used in this blog is included in the github repository here.
The dashboard allows us to observe trends and the relationship between weather related data and the price of the electricity market over time. Several of the graphs on the dashboard examine how the index price for the SEMOpx electricity market changes with respect to the wind speed data obtained from the tomorrow.io API. The drop-down menu at the top-left of the dashboard allows us to choose the index price for the different intra-day markets to use in comparisons but in this case we will look at the SEM_IDA3 auction data.
By providing us with both observed and forecasted data, the tomorrow.io allows us to evaluate the accuracy of the forecasts. In our example dashboard we have included graphs which compare forecasted values and observed values for wind speed and load forecasting (NI &ROI).
The Grafana dashboard polls the HDB on a regular basis and a refresh rate can be specified under the drop down menu on the far top right of the dashboard. We can also specify a range for our data analysis by clicking on the clock icon on the top of the page.
Raw Data Access
In this blog post we have used Grafana to provide visual displays of ingested datasets. The Electric Storage Company‘s analytics team use a python interface to access the underlying data and create aggregated datasets for use in machine learning libraries and other advanced statistical tools. More information on how to access the underlying database via Python can be found here or by contacting support@aquaq.co.uk.
Observations
Load & Load Forecasting
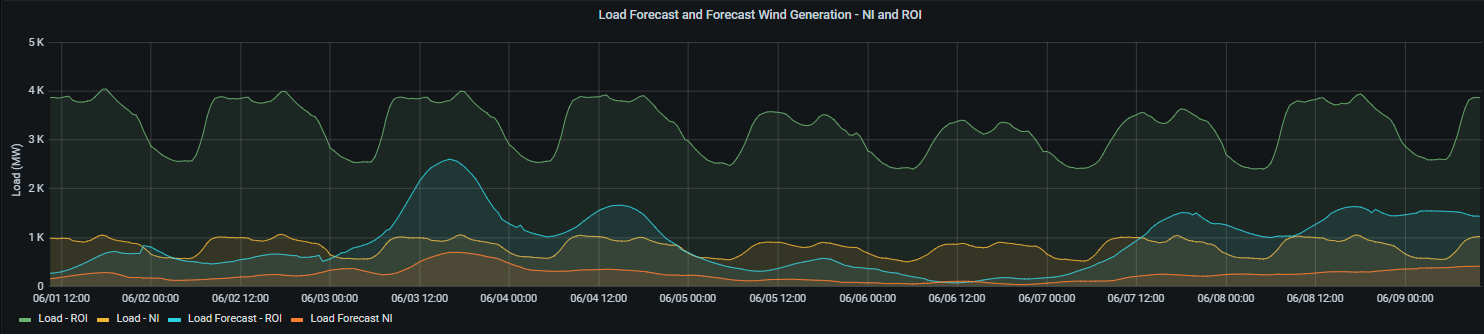
The first graph on the dashboard displays the load and load forecasts for NI and ROI in MW. The data mirrors a wave-like pattern for an intraday interval. The load in both areas are lowest in the early morning hours, increasing to a relatively stable peak from between 09:00 to 18:00 before steadily decreasing again after 20:00. We can see that the load in ROI exceeds the load in NI but this is to be expected due to the size difference between the two areas.
Wind Speed & Index Price Variations
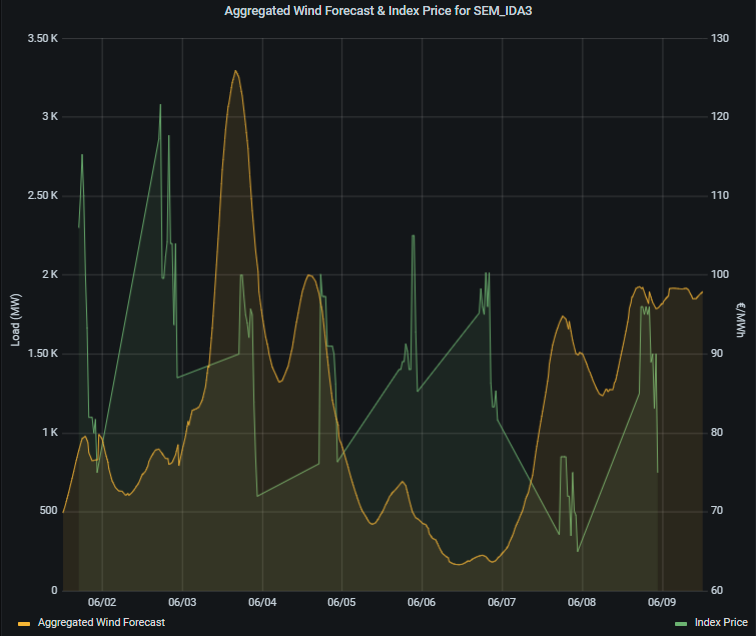
Given the relationship between wind powered electricity generation and wind speeds, we would expect to see a negative relationship between observed wind speeds and the price of the electricity market. Low wind speeds should lead to low levels of wind-generated electricity and therefore the dynamics of supply and demand would cause the electricity prices to increase. If we observe the Aggregated Wind Forecast & Index Price graph we can see that this tends to be true. A forecast of higher wind speeds within a time interval seems to trigger a dip in the index price of the electricity market.
Shortwave Radiation & Cloud Cover
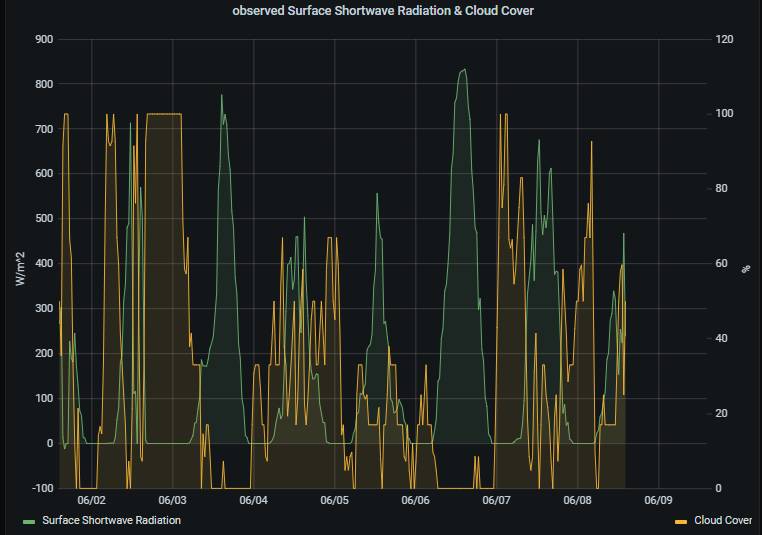
The tomorrow.io API provides us with various weather-related data including the percentage cloud cover and the level of short wave radiation in a particular location. Different parts of the Earth reflect shortwave radiation back into space at different rates. The percentage of energy from the sun reflected back into space is called an albedo. Thick clouds have a high albedo and therefore areas with high percentages of cloud cover should reflect radiation at a higher rate. As radiation is reflected back into space, less radiation reaches the Earth’s surface. Therefore we should see the cloud cover of an area having an inverse relationship with the radiation absorbed by the Earth’s surface. If we look at the data, we can see that this dynamic is true. In a similar manner to the graph of wind speeds and index price fluctuations, we can see that time periods where there is a peak in cloud coverage result in low levels of radiation for that area. Similarly, time periods where there is low cloud cover for the area are coupled with an increase in short-wave radiation.
Conclusion
We have demonstrated in this blog how we can download and extract data from two different APIs and store these within a TorQ framework. We have also demonstrated how this data can be analysed and presented using Grafana dashboards and AquaQ’s Grafana kdb plugin and some example observations that can be drawn from this data.
If you’re interested in learning more about any of the technologies mentioned in this post or want more information on either The Electric Storage Company‘s PARIS platform or the SEMO-downloader, get in touch at info@aquaq.co.uk.
Share this: