Belfast Bikes Traffic Shifts to a Different Gear
Data Intellect
The Belfast Bikes public bicycle rental scheme, currently sponsored by Just Eat, has been running since April 2015. It has 47 stations and, according to the operator nextbike, “over 300 bikes”. However we only ever saw evidence of 221 bikes in operation. A previous blog post on this looked at leveraging TorQ for data collection from the Belfast Bikes network. The data available at that time was limited to the number of bikes present at each station at a given time. However, the API was recently updated to include the ID numbers of the bikes present at the station. This meant we could track individual bikes around the system and work out where each journey started and ended, as well has how long it had taken. The TorQ-Bikes pack has been upgraded to reflect this. For the purpose of this analysis a journey is considered to occur whenever a bike leaves one station and appears at another. As a result we will not track occasions where the bike is taken from and returned to the same station. We also decided to disregard journeys lasting less than 2 minutes or more than 12 hours to remove anomalous data.
[iframe src=”https://aquaq.co.uk/wp-content/uploads/datavis/bikes/map.html” width=100{e673f69332cd905c29729b47ae3366d39dce868d0ab3fb1859a79a424737f2bd} height=600][/iframe]
The above animation shows two weeks’ worth of journeys, beginning 26th February 2020, compressed into one day. The blue dots represent bikes and the orange dots are Belfast Bike stations. Since all we actually know is where and when each journey starts and ends, Google Maps was used to fill in plausible intermediate data. For every station-station journey seen, the Google maps API was called with their latitude and longitude. This returned encoded, unevenly spaced waypoints, which Google uses to draw the route. Evenly spaced points had to be interpolated between these to give a dot travelling a consistent distance per time interval (we assume constant speed of bikes). Each bike’s position is estimated at every 15 second interval. The animation itself was created using Torque.js and Leaflet.
In reality, many journeys will not have actually been along the most direct route as given by Google Maps. To mitigate against this, we only included journeys where the average speed of the bike (assuming it were travelling directly) would be between 3mph and 25mph. Hence what you see should mainly be journeys where the rider’s intention was getting from one station to another.
This data gives an interesting insight into usage. Perhaps the most notable pattern is the way activity spikes around rush hours. From 07:30 until 09:00 there is a flood of activity around South Belfast (especially the stations on the Ormeau Road) as people head towards the city centre. There is a similar, though smaller-scale, pattern seen in East Belfast along the Newtownards Road. We can then see the comparable outward flow of bikes between 16:30 and 18:30. People’s destinations within the city centre are spread, but there is a notable hotspot around Lanyon Place (formerly Central) Station. Perhaps less obviously, the Titanic Quarter has a large share of bike activity. A significant portion of this may be the presence of Belfast Met, but there is also heavy usage of the station further up Queens Road close to the Science Park and associated businesses. That’s just a couple of observations – feel free to move, zoom, pause and see if you can find anything else interesting!
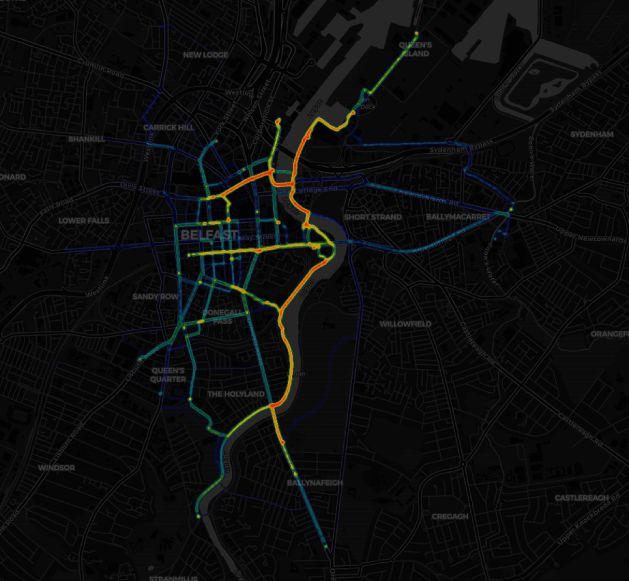
The heat map above is generated from the same data as the animation and gives an idea of the routes people take around the city. Some of the features we see are almost certainly artefacts of Google Maps’ routing (for instance its very high opinion of the Queen’s Bridge over the Lagan and low opinion of the Albert Bridge). Nonetheless it highlights the features also discernible in the animation: the main axis of travel is North-South along the river, with a fair amount of usage throughout the city centre. Despite a number of stations, usage in the North and West of the city is low, with the ‘Falls Road’ station being used only 8 times in the data available, and ‘Mater Hospital / Crumlin Road’ 6 times (though in the case of the Mater it makes sense that people going in or out of hospital don’t feel inclined towards a brisk cycle).
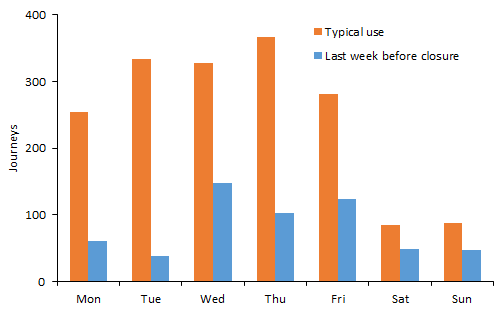
‘Last week before closure’ is 18/03/2020 to 24/03/2020 , running Wednesday to Tuesday
Looking at usage over time, one clear pattern is the drop-off in usage as COVID-19 impacted both work and socialising. The bar chart above compares the last week of data collected before the scheme was shut down (running from Wednesday 18th March to Tuesday 24th March) to more normal usage (averages from 26th February to 10th March). By the start of this last week, social distancing was already recommended and many had begun to work from home, so already usage is much lower than normal. On Friday 20th March businesses such as restaurants, bars and gyms were forced to shut. Then on Monday 23rd March the lockdown was announced. Given that they are weekdays, Monday 23rd and Tuesday 24th have exceptionally low usage. On 25th March, all Belfast Bikes were removed from stations.
In a normal week, we can see that many fewer journeys are taken at the weekend compared to during the week, suggesting that a large proportion of bike usage is for work rather than leisure. Interestingly, these weekend journeys seemed more robust in the face of impending lockdown.
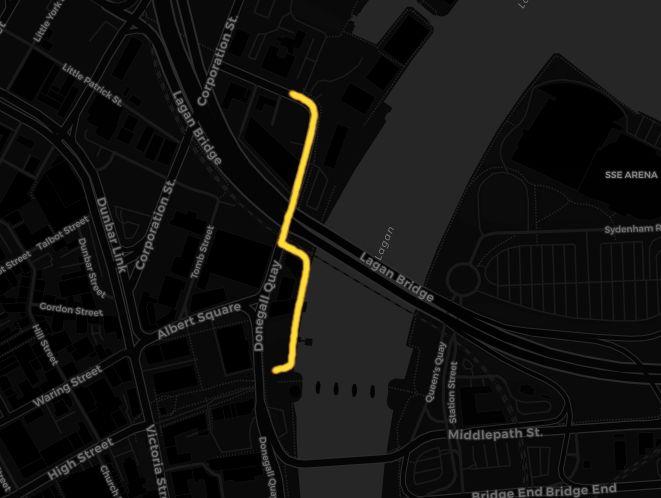
Among the more noteworthy popular routes is one of the shortest. Almost every weekday evening pre-coronavirus, a journey was taken from Corporation Square to Donegall Quay. This is a distance of 407 metres, taking between 2 and 2-and-a-half minutes. Presumably this is just one individual who in the evening (but definitely not the morning) feels that they want to save around 3 minutes versus walking. We can only hope that the bike stations are directly along their route and they are speedy at checking their bike out and in – otherwise they may actually be losing time. In addition, they presumably are members of the scheme, which gives them free rides up to 30 mins. Otherwise the journey would cost a flat £1 – a fair amount to pay every day for less than 3 minutes saved.
Share this: